Incidents Page
On the navigation bar, select . The Incidents page is displayed. The Incidents page provides a breakdown of incidents by severity and category, allowing you to focus on incidents of interest, for which you can view details. For any given incident, you can view the severity, client impact, root cause, and recommendations, as well as the events, anomalies, data, or problems that were used to identify the incident.
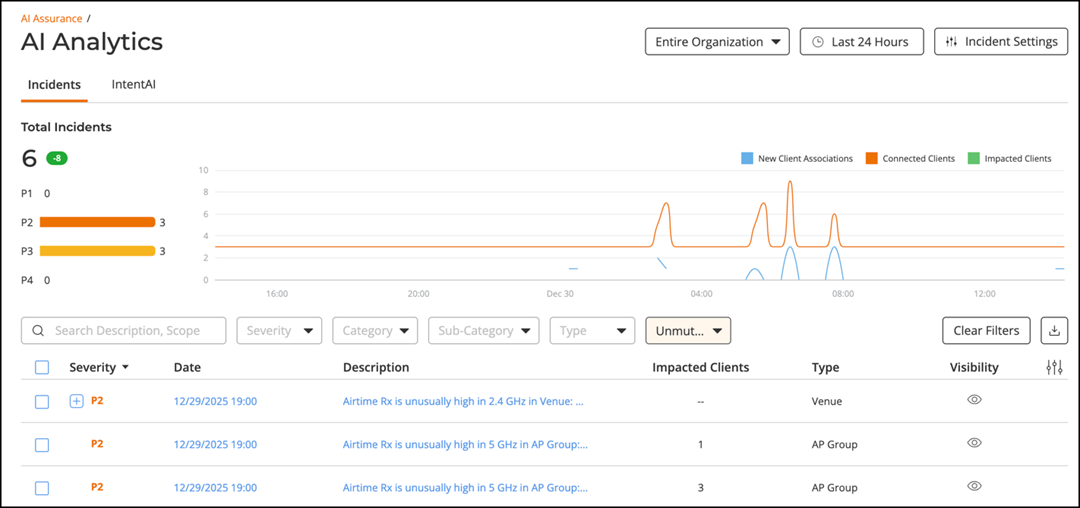
The Incidents page has the following components:
The network hierarchy filter and Date and Time filter are displayed in the upper-right corner of the Content panel. These options control the elements displayed within the Content Panel. To modify these options, refer to Navigating the RUCKUS One Portal.
Total Incidents Bar Graph
Total Incidents displays the total number of incidents in "big number" format, as well as the number of incidents per severity in "bar graph" format, that occurred for the selected network node and date/time filters. The capsule next to the Total Incidents count indicates the change in incident volume compared to the previous period, based on the currently selected time range. A green capsule displays the number of incidents decreased from the previous period. A red capsule displays the number of incidents increased from the previous period. A grey capsule with a 0 indicates no change in the incident count. The previous period is determined relative to the selected range. For example, if the current period is 'Last 7 Days', the comparison is made against the 7 days preceding that range.
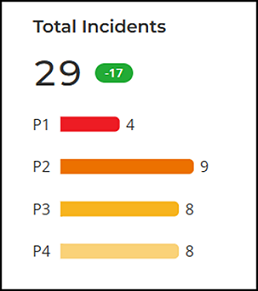
Each severity level is identified by priority, ranging from P1 to P4 (P1 being the highest priority and P4 the lowest). The severity of an incident is determined by the type of the incident, duration of the incident, number of impacted clients, number of impacted APs, scope of the incident (example: a venue-level incident is more severe than an AP-level incident), and other factors. Each severity level is identified by priority and color as listed in the following table:
Incident Timeline Tile
The interactive time-series chart provides a graphical representation of client trends, showing the new clients connecting to the network, the number of clients actively connected to the network, and the number of clients affected by the network incidents that occurred for the selected network node and date/time filters. Each client incident is identified by the following color lines:
- Blue line: This line represents the new client associations. The client count value includes all unique clients that attempted to connect to the network, including both failed and successful connections.
- Orange line: This line represents the connected clients. The client count value indicates only successfully connected clients to the network.
- Green line: This line represents the impacted clients. The client count value includes the number of clients impacted by the incidents, and it also includes clients who were unable to connect.
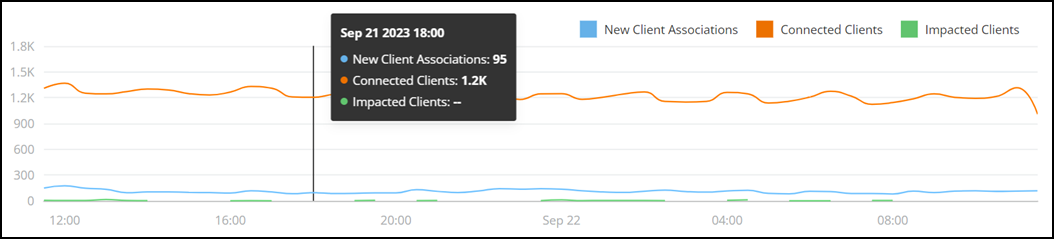
Pausing your cursor at any instance on the timeline displays a tooltip showing the number of new clients, impacted clients, and connected clients based on the selected network node and date/time filters. By default, the graph displays data for all three client categories. You can toggle the visibility of each category - New Client Associations, Connected Clients, or Impacted Clients - using the options at the top of the graph. When a category is hidden, its corresponding icon appears grayed out.
Incidents Table
The Incidents Table displays a summary of each incident that occurred for the selected network node and date/time filters. If there are more than 10 incidents, then you can select the number of incidents displayed per page from the drop-down menu at the bottom of the page.
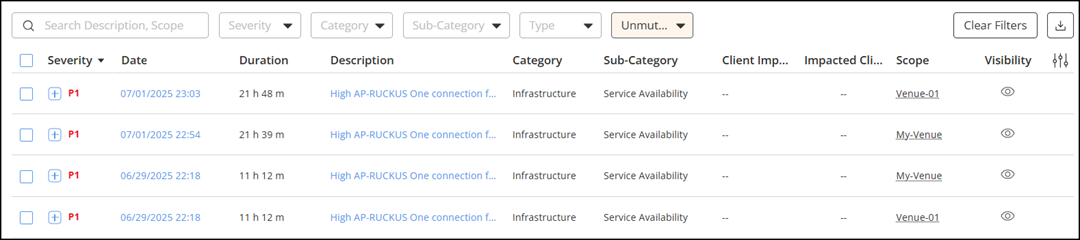
Above the table are search fields that allow you to refine the incident list based on your selected search criteria. You can use the Search option to display only the table entries matching the specified scope or description; enter a minimum of two characters. Additionally, you can filter the list of devices by selecting options from the drop‑down menus of the Severity, Category, Sub-Category, Type, and Visibility (muted or unmuted) fields. Use the Clear Filters option to remove the applied filters.
Each incident is made up of a number of attributes. Incidents that impact multiple nodes of a network hierarchy are grouped together. This group is indicated with a + icon displayed beside the incident severity. Click + icon to expand the group and view more information about other incidents that contribute to the selected incident and information about the parent incident to which the selected incident contributes.
The table has the following attributes:
- Severity: Displays the severity of an incident, ranging from P1 to P4 (P1 being the highest priority and P4 the lowest). The severity of an incident is determined by the type of the incident, duration of the incident, number of impacted clients, number of impacted APs, scope of the incident (example: a venue-level incident is more severe than an AP-level incident), and other factors. Clicking this attribute displays the Incident Details page for the associated incident. You can filter incidents by severity using the Severity drop-down above the table.
- Date: Displays the date and time when the incident started. Clicking this attribute displays the Incident Details page for the associated incident.
- Duration: Displays the duration of the incident.
- Description: Displays a short description of the incident. To view the root cause, click Description attribute. The Incident Description dialog box is displayed. This dialog box displays the incident description and root cause. To view the incident details, click More Details in the Incident Description dialog box. The Incident Details page is displayed. For more information, refer to Incident Details.
- Category: Indicates the functional classification of the incident based on its nature or impact area, such as Connection, Performance, Infrastructure, or Security. You can filter incidents by category using the Category drop-down above the table.
- Sub-Category: Displays
the sub-category of the respective categories (connection, performance,
infrastructure, or security). You can filter incidents by sub-category using
the Sub-Category drop-down above the table.
Incident Details Based on Categories and Sub-Categories
- Client Impact: Displays the percentage of clients impacted by the incident.
- Impacted Clients: Displays the number of clients impacted by the incident.
- Scope: Displays the area of the network in which the incident was detected. Pausing your cursor over the scope displays the entire path of the network node.
- Type: Displays the entity level at which the incident occurred. You can filter incidents by type using the Type drop-down above the table.
- Visibility: Indicates whether an incident is muted or
unmuted. This column helps you quickly distinguish between the two using
visual icons; the
 icon represents an unmuted incident, while the
 icon represents a muted incident. By default,
only unmuted incidents are displayed in the table. Muted incidents are
hidden unless explicitly filtered using the Visibility filter and
do not trigger email or webhook notifications. You can use the Visibility filter
above the table to view all, muted, or unmuted incidents.
icon represents a muted incident. By default,
only unmuted incidents are displayed in the table. Muted incidents are
hidden unless explicitly filtered using the Visibility filter and
do not trigger email or webhook notifications. You can use the Visibility filter
above the table to view all, muted, or unmuted incidents.
Click the  icon
at the top right of the table to export and download the complete incident list
in
the csv format.
icon
at the top right of the table to export and download the complete incident list
in
the csv format.
Click the Date attribute to display the Incident Details page for the associated incident. This page displays a detailed report of the specific incident, including the information provided in the Incidents table, as well as root cause analysis and recommended actions, network impact, and associated metrics. For more information, refer to Incident Details.
Incident Settings
Incident Settings allow you to manage how network incidents are generated and prioritized to align with operational requirements. Using these settings, you can configure incident severity overrides and control whether specific incident types are actively monitored and generated in your network.
By default, incidents are generated and assigned a dynamic severity based on their impact as determined by the AI/ML algorithms. You can override this behavior and assign a static severity (P1 – P4) for each incident type. This ensures business-critical incident types are always triggered at the configured severity in your workflows. Once the severity level is updated, the new setting applies only to incidents of that type generated after the change.
All incident types are activated by default. You can deactivate specific incident types based on operational requirements. When an incident type is deactivated, new incidents of that type are no longer generated. This helps prevent unnecessary alerts for non-critical incidents and reduces clutter in the Incidents table. Incidents generated before deactivation remain visible in the Incidents table. Use this feature carefully, as disabling certain incidents may hide important network issues that could affect network performance. Activation or deactivation may take up to 24 hours to be fully enforced, depending on the incident type.
If incidents are deactivated and reactivated within short intervals, the incident timeline chart may display incidents from the deactivated period due to how events are processed.
Be aware of the following consideration when working with Incident settings:
- Incident creation and severity assessment are dynamic, iterative processes. An incident’s initial severity may be updated after creation as the system continuously recalculates its impact based on updated analysis or administrator-defined severity overrides.
Managing Incident Settings
To manage Incident Settings preferences, complete the following steps:
- From the navigation bar, select AI Assurance > AI Analytics > Incidents. The Incidents page is displayed.
- Click Incident Settings.
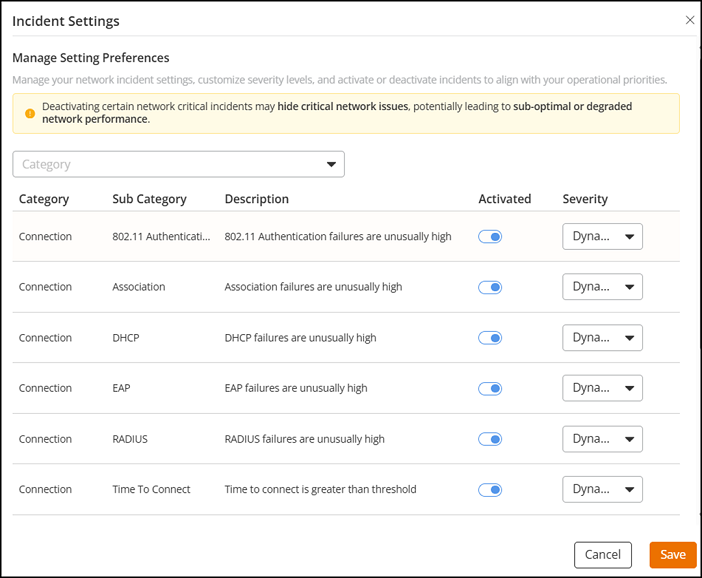
The Incident Settings
sidebar is displayed.
The sidebar lists all available incidents, including their identifying attributes:
- Category: Indicates the functional classification of the incident based on its nature or impact area, such as Connection, Performance, Infrastructure, or Security.
- Sub Category: Displays the sub-category corresponding to the incident's Category.
- Description: Displays a short description of the incident.
- Activated: Activate or deactivate an incident type using the toggle. The recommended setting is to keep incident types activated.
- Severity: Select one of the following options to override incident severity. The recommended setting is Dynamic.
- Click Save to apply the changes.
Muting or Unmuting an Incident
Based on business priorities or operational considerations, you may choose to ignore certain incidents. In such cases, the incidents can be muted to prevent them from cluttering the Incidents table and triggering unnecessary notifications. You can manage incident visibility in the Incidents table using the Mute and Unmute options. By default, all incidents are unmuted and automatically displayed in the table. Muting an incident hides it from the Incidents table and suppresses both email notifications and webhook triggers. Muted incidents are also excluded from incident counts and related graph. To review muted incidents, use the Visibility filter, which provides options to show all, muted, or unmuted incidents. You can mute or unmute multiple incidents in bulk.
Muting an incident applies only within the current scope (such as Venue, AP Group, and so on) and does not affect its visibility in other scopes where the incident may also appear.
Complete the following steps to mute or unmute an incident:
- In the Incidents Table, select the radio button next to
the incident you want to mute or unmute.
You can select multiple incidents using the checkboxes to perform bulk mute or unmute actions.
Note: Selecting a group incident does not automatically select its associated child incidents. To mute or unmute all incidents within a group, each child incident must be selected individually.The action bar appears at the top of the table with Mute and Unmute options. Based on the current status of the selected incident(s), either Mute or Unmute will be disabled (grayed out).
- Click Mute or Unmute as
appropriate to update the visibility of the incident.
The Visibility column in the Incidents table will reflect the change with the corresponding icon.