Viewing the Wired Network Insights
You can access the Wired Network Insights page from the following main pages:
Complete the following steps to view wired network insights:
- On the navigation bar, select
.
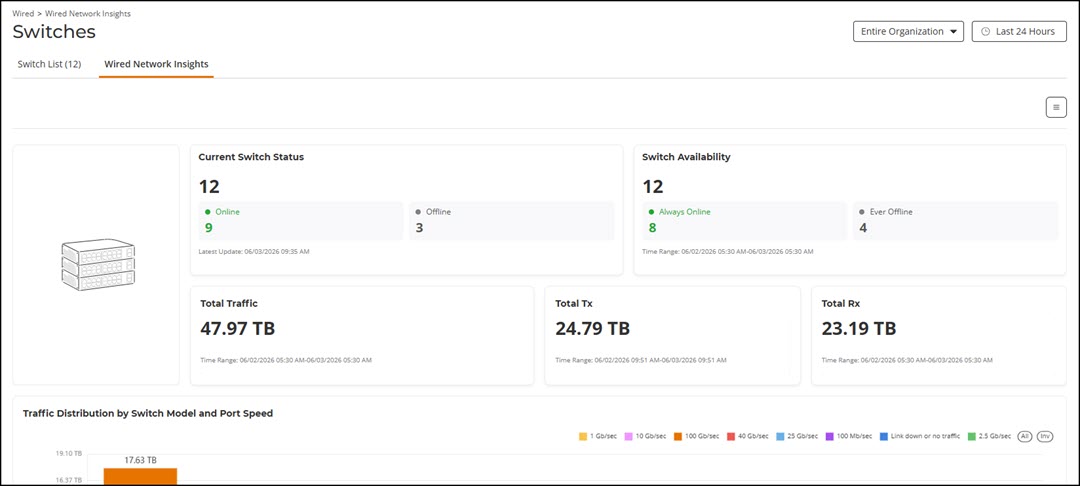
navigation has changedThe Wired Network Insights page is displayed.New changes to UI
The Wired Network Insights page has the following components:
- Overview tile
- Traffic Distribution by Switch Model and Port Speed tile
- Top Switches by Traffic tile
- Top Switches by Traffic Over Time tile
- Top Switches by PoE Usage tile
- Top Switches by PoE Usage Over Time tile
- Top Switches by Errors tile
- Top Switches by Errors Over Time tile
- Traffic Trend tile
- Error Trend tile
The data displayed is for the selected time period in the Date and Time filter.
Note: All counts shown in bar charts, pie charts and tables are exact values. The counts in trend charts are approximate values.Some of the tiles have the option to view the report in graphs and tables. The Graph and Table tabs are displayed on top of the applicable tiles. By default, in those tiles, the reports are displayed in graphical format. If you want to view the report in table format, click the Table tab.
The data displayed on this page is based on the selected Date and Time filter and Network Hierarchy filter. Use the Date and Time filter in the upper-right corner to select a predefined time range or configure a custom date and time range. Use the Network Hierarchy filter to refine the displayed data by network scope.
The top right corner of the page also displays options to download reports in PDF and PNG formats. You can also share the report via e-mails on-demand or periodically by configuring a schedule (daily, weekly, or monthly).
All of the tiles described above are explained in detail under the Reports section. Refer to Wired Report.