Viewing the Switch Panel
- On the navigation bar, select .
- Click the switch name to view
the panel details.The details page is displayed for the switch, defaulting to the Overview tab.
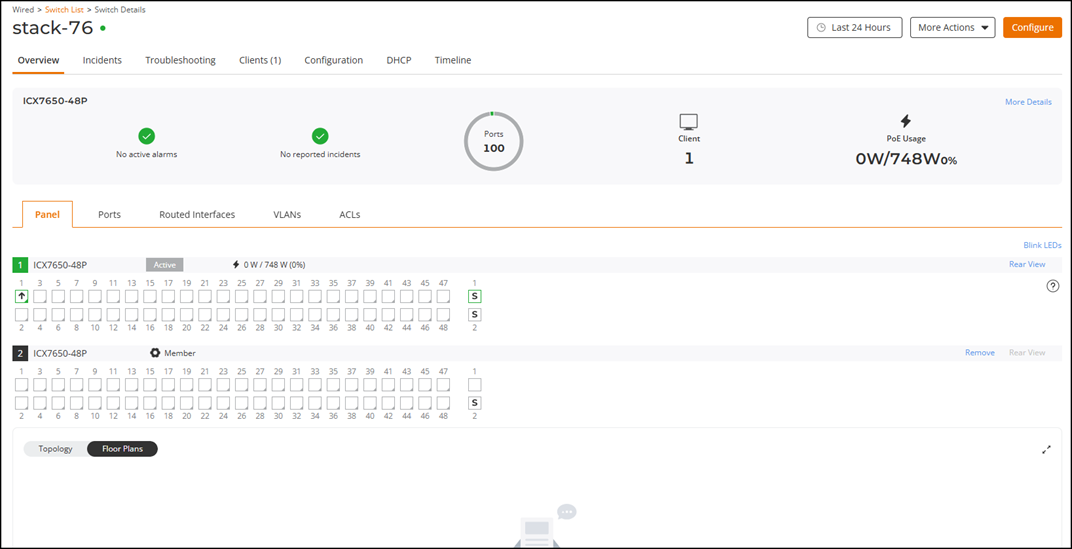
- Click the Panel sub-tab to displays a graphical representation of the
switch front panel (port side) by default.The tab dynamically displays either a single switch or multiple stack members, depending on the switch configuration.
- Review the stack members displayed individually, each with its own panel and port configuration. Disconnected members appear inactive and are visually distinguished from active members, while members that have never connected to the cloud are indicated as Never Connected.
- Click the Rear View
hyperlink to view the non-port side. To switch back, click the Front View
hyperlink.Note: Front and rear views of the switch are available. The Front View (port side) is displayed by default.Note: The ICX 8100 and ICX 8100-X models are now supported and appear in the list. Some advanced metrics (like breakout ports) are not applicable to ICX 8100. Stacking details appear only for ICX 8100-X.
- Hover your cursor over a port slot to display a tooltip showing the following
information:
- Port: Displays the port number of the switch.
- Name: Displays the port name of the switch.
- VLAN: Displays the VLAN assigned to the switch port.
- Port Speed: Displays the speed of the switch port.
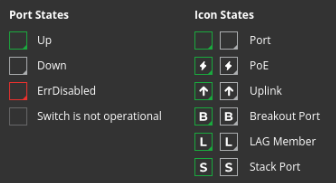
- ErrDisabled: Specifies whether the port is in an error-disabled state (Yes or No). When a port is in an error-disabled state, the port slot in the front panel of the switch is indicated in red.
- ErrDisable Reason: Displays the reason for the port being in the error-disabled state.
- Port State: Displays the status of the switch (Up or Down).
- Connected Device: Displays the name and IP address of the next neighbor device for a switch, and the neighbor port number for a stack connection.
- PoE Usage (Consumed/Allocated): Displays the PoE usage level of the switch port.
- PoE Device Type: Displays the PoE type used by the switch.
- (Optional) Click
 to learn about the port
slot indications on the switch front panel.
to learn about the port
slot indications on the switch front panel.
- (Optional) Click any port slot to open the Edit Port sidebar, where you can view or modify detailed configuration and status information.
- (Optional) Click Blink LEDs to open a sidebar that allows you to make the switch’s LEDs blink for easier physical identification. You can set the duration between 15 and 120 seconds and select whether to blink LEDs on all units or a specific stack unit. Click Start to begin blinking or Cancel to exit.
- Review the visual charts in the Panel tab to monitor switch activity and
health. The following details are displayed:
- Traffic Overview: Displays total switch traffic trends over time. You can view aggregate traffic or select specific ports, see throughput categorized by Tx, Rx, and Total traffic and hover over data points to view exact traffic values.
-
Resource Utilization: Shows CPU, memory, and PoE usage percentages to help identify load conditions and power allocation issues.
-
Top 10 Ports by Traffic: Displays the ten ports handling the most traffic. You can view the real-time data chart or a donut graph summarizing usage per port.
-
Top 10 Ports by Errors: Lists the ports with the highest error counts. A donut chart and time-based graph help identify error trends and affected interfaces. Hover your cursor over any chart element to view more detailed data.
- Click Floor Plans tab to view the switch placement if it is mapped to a floor plan. If not, a message appears indicating that the switch is not placed on any floor plan.
- Click Topology tab to view the logical switch or stack topology view.