Creating Customizable Dashboard Canvases
The Customizable Dashboard Canvas lets you create and share multiple canvases within your tenant account. You can design dashboards that highlight key data and serve as personalized landing pages. This feature enhances data accessibility and collaboration, allowing you to quickly understand the status of your devices. It also enables you to integrate widgets across canvases, export them as dashboards, and switch between dashboards based on your needs.
- On the RUCKUS One web interface, click the
=GUID-D9EE477C-CFF5-440D-B39C-60C21185A2C3=1=en-US=Low.png) icon in the UI header.
icon in the UI header.
- Click the
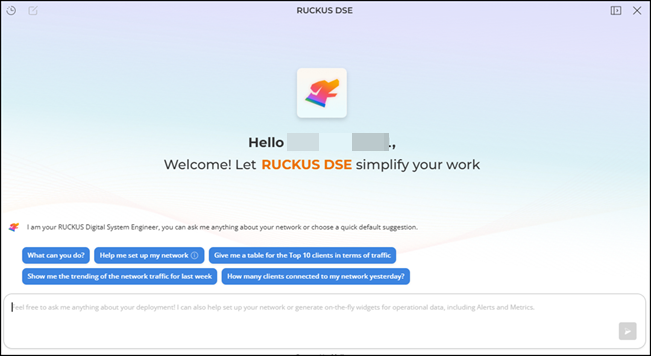
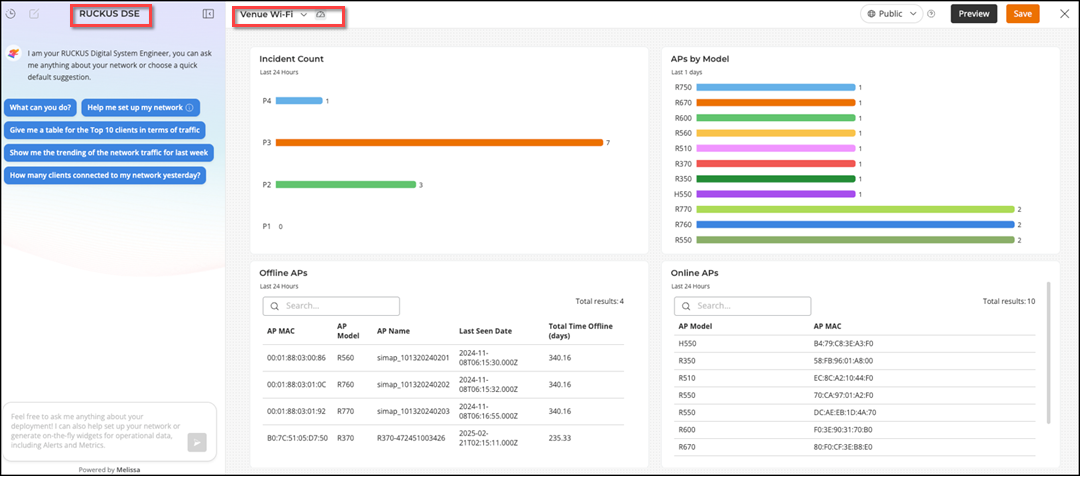
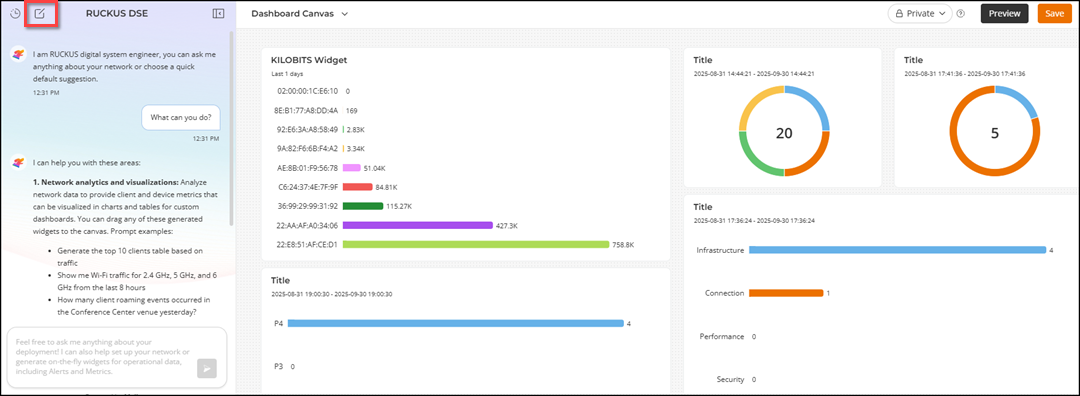
 icon to invoke the Expand My Canvas function.The window refreshes displaying the RUCKUS DSE chatbox on the left side (allowing you to continue your interactive chat) and your canvas on the right side (allowing you to see and interact with your widgets and other canvas options).
 - Choose a default suggestion or type your request in the chatbox.
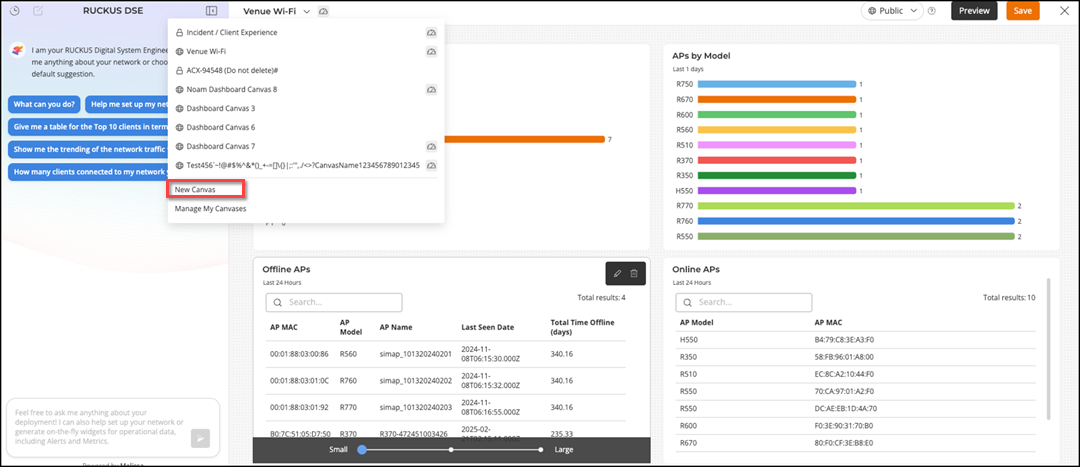
- Select New Canvas from the drop-down menu to create a new dashboard canvas.
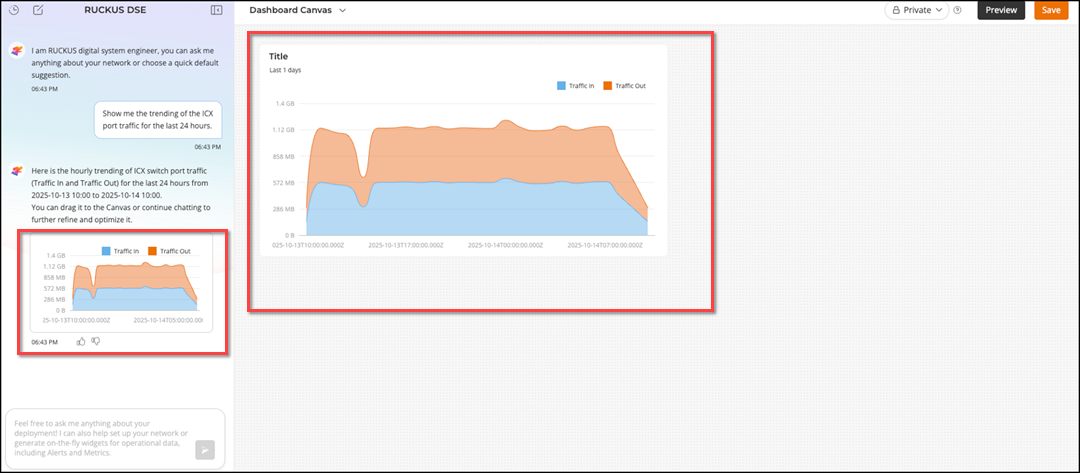
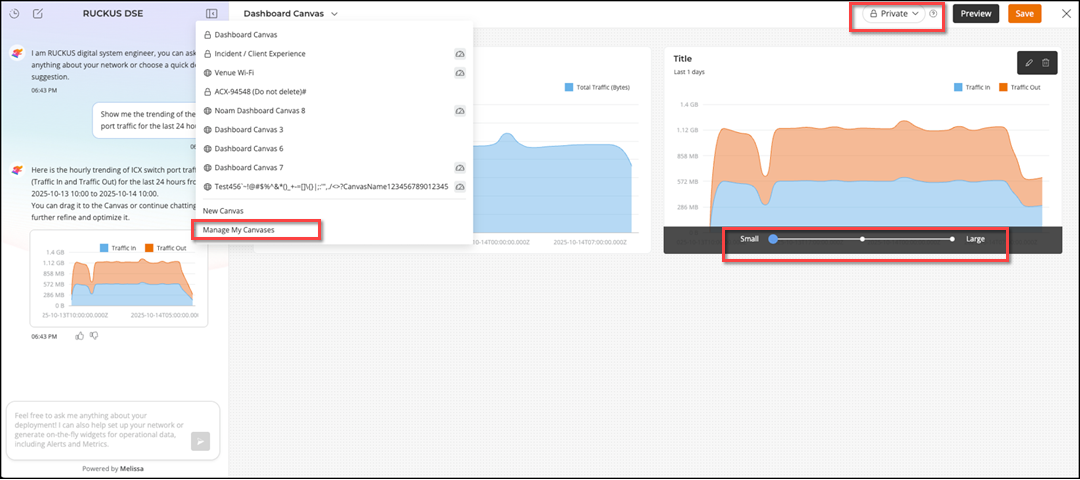
- Type your request in the RUCKUS DSE chatbox. In this example, the RUCKUS DSE is asked to show ICX switch port traffic for the last 24 hours. It analyzes the network and creates a chart with incoming (Traffic In) and outgoing (Traffic Out) network traffic.
- You can make the canvas public
or private. It is private by default. Select Private mode to hide the
canvas from public access. The canvas will only be visible to the owner and the
 icon is displayed beside the canvas name. Select Public mode to publish
the canvas to all administrators in the tenant; the
icon is displayed beside the canvas name. Select Public mode to publish
the canvas to all administrators in the tenant; the  icon is displayed beside the canvas name. Alternatively, you can change the canvas mode by selecting Manage My Canvas and clicking the
 icon in the
Manage My Canvases sidebar to edit the canvas
visibility setting.
icon in the
Manage My Canvases sidebar to edit the canvas
visibility setting.If a canvas is used as a dashboard landing page by the owner or by other users in the tenant, the
 icon is displayed beside the canvas name. For
more information, refer to Using a Canvas as Your Dashboard Landing Page.
icon is displayed beside the canvas name. For
more information, refer to Using a Canvas as Your Dashboard Landing Page. - Click Preview to review the Dashboard Canvas page you created.
- Click Save to save the
widgets to the Dashboard
Canvas page.
As you add and save additional widgets to your Dashboard Canvas, they will be arranged in rows. The Dashboard Canvas interface allows you to do the following with saved widgets:
- Pause your cursor over widget charts and graphs to view real-time detailed information.
- Edit the widget by
clicking the icon on the
widget to provide a meaningful name in Widget Title,
or time in Time Range. You can select a time range from the
drop-down menu options and also reset to the default time
range.
- Click
 icon to delete
the widget.
icon to delete
the widget. - Pause your cursor over a widget chart and increase or decrease the size of the widget using the Small to Large slider (as shown in the preceding Figure).
- Click the
 icon on the RUCKUS
DSE chatbox to start a new conversation with RUCKUS DSE to
create new widgets and canvases.
icon on the RUCKUS
DSE chatbox to start a new conversation with RUCKUS DSE to
create new widgets and canvases.
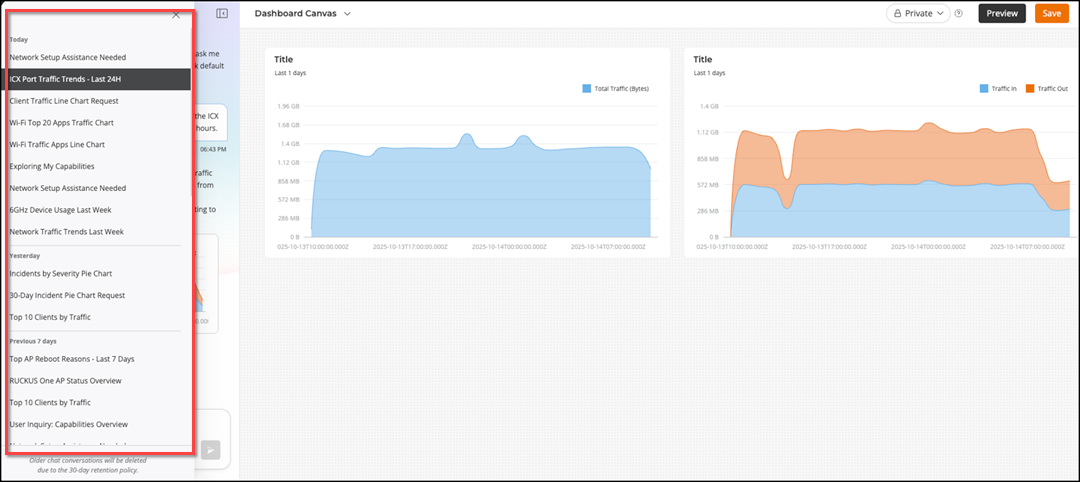
- (Optional) Click the
 icon to view the
conversation history with RUCKUS DSE. Here, you can edit conversation titles and
manually delete conversations. Note: Each administrator can retain up to 50 conversations (chats) in the history, with messages in each conversation retained for a maximum of 30 days. Once all messages in a conversation expire, the conversation will be automatically deleted from the conversation history. Deleted conversations do not impact saved widgets.
icon to view the
conversation history with RUCKUS DSE. Here, you can edit conversation titles and
manually delete conversations. Note: Each administrator can retain up to 50 conversations (chats) in the history, with messages in each conversation retained for a maximum of 30 days. Once all messages in a conversation expire, the conversation will be automatically deleted from the conversation history. Deleted conversations do not impact saved widgets. - (Optional) Click the
 or
or
 icons in the RUCKUS DSE chatbox to express whether
you find the AI response useful or not.
icons in the RUCKUS DSE chatbox to express whether
you find the AI response useful or not.