Getting to Know the Dashboard

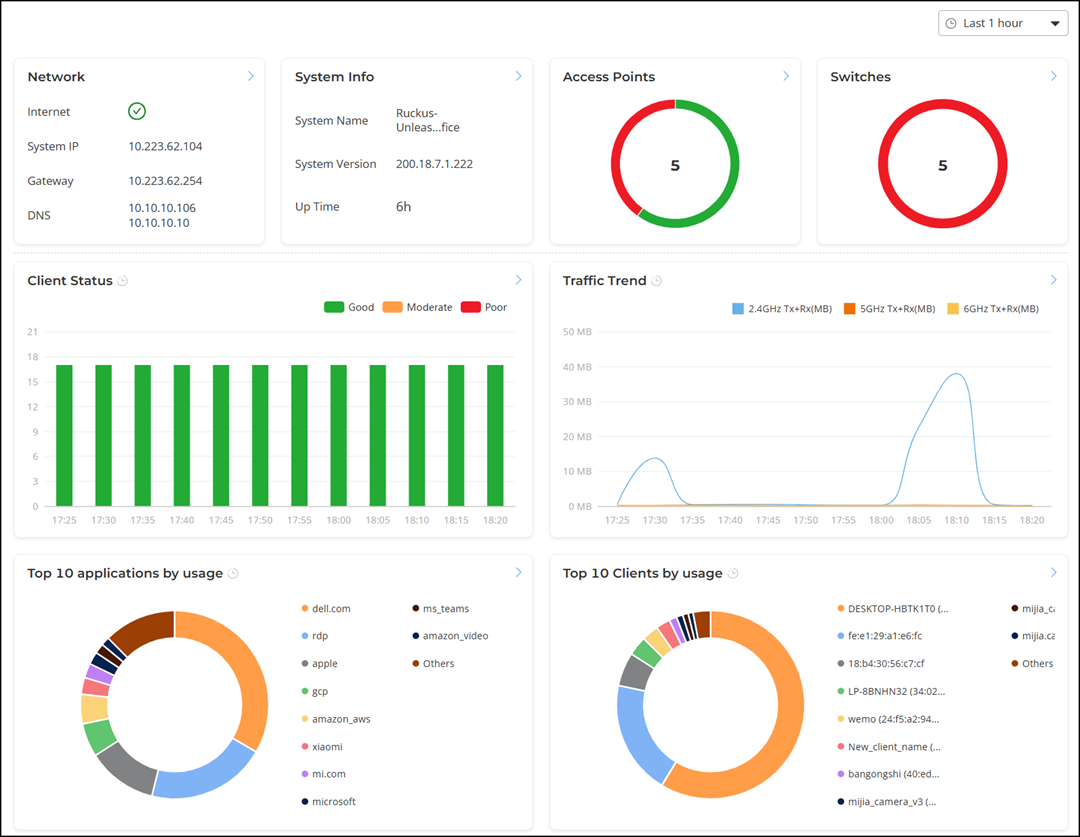
The Dashboard provides a snapshot of the RUCKUS Unleashed-managed networks and devices along with associated alarms and events.

Unleashed Dashboard

Unleashed Dashboard Elements

Number Element Description
1 Network Displays the network details, including the internet status, public IP address, Gateway IP address, and DNS servers.

Click the icon to see additional information. Alternatively, from the RUCKUS Unleashed main menu, click System Settings > Network Settings > IP Settings.

2 System Info Displays the system information, including the system name, current system firmware version, and up time.

Click the icon to see additional information. Alternatively, from the RUCKUS Unleashed main menu, click System Settings > System Management > System Info.

3 Access Points Displays the number of working APs.

Click the icon to see additional information. Alternatively, from the RUCKUS Unleashed main menu, click Wi-Fi > Access Points > AP List.

  Switches Displays the number of connected and disconnected Unleashed-managed switches.

Click the icon to see additional information. Alternatively, from the RUCKUS Unleashed main menu, click Wired > Switch List.

5 Client Status Graphically displays the number of connected clients and signal quality of the clients across all the connected WLANs at 5-minute intervals (over the last one hour) as a bar chart (Excellent, Moderate, Poor).

Pause the pointer over a specific bar to view the signal quality of the client. You can customize the Client Status bar chart by selecting or deselecting Good, Moderate, or Poor.

Click the icon to see additional information. Alternatively, from the RUCKUS Unleashed main menu, click Clients > Wireless > Wireless Clients.

6 Traffic Trend Graphically displays the amount of traffic (transmitted and received) carried out on the 2.4 GHz, 5 GHz, and 6 GHz AP radios, respectively, on the connected WLANs.

Pause the pointer over a section of the chart to display a breakdown of the Tx and Rx values on the 2.4 GHz, 5 GHz, and 6 GHz AP radios, respectively.

Click the icon to see additional information. Alternatively, from the RUCKUS Unleashed main menu, click Wi-Fi > Wi-Fi Networks > Wi-Fi Networks List.

7 Top 10 applications by usage Displays the top 10 applications by usage. By default, application names are displayed.

Pause the pointer over a section of the pie chart to display a breakdown of total, uplink, and downlink values.

Click the icon to see additional information. Alternatively, from the RUCKUS Unleashed main menu, click Security > Traffic flow ACL > Application Overview.

8 Top 10 clients by usage Displays the top 10 clients by usage.

Pause the pointer over a section of the pie chart to display the client device name with MAC address and percentage of total traffic for this client.

Click the icon to see additional information. Alternatively, from the RUCKUS Unleashed main menu, click Security > Traffic flow ACL > Application Overview.