Displaying RMON history

By default, all active ports generate two history control data entries per active port. An active port is defined as one with a link up. If the link goes down, the two history entries are automatically cleared.

The following history entries are generated for each device:

  • A sampling of statistics every 30 seconds
  • A sampling of statistics every 30 minutes

To display Remote Monitoring (RMON) history, perform the following steps.

  1. Click Monitor on the left pane and select RMON .
  2. Click History .

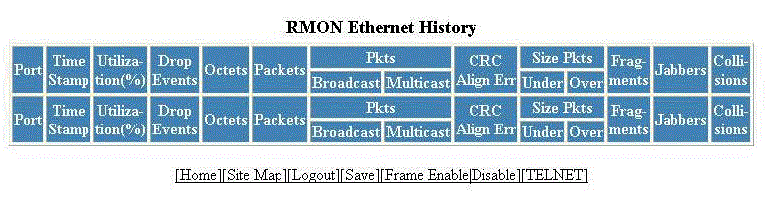
    The RMON Ethernet History window is displayed as shown in the figure below.

    Monitoring the RMON Ethernet history

    Description of the fields in the RMON Ethernet History window
    Field

    Description

    Port

    Displays the port for which the history data is being presented - stack-unit/slotnum/portnum.

    Time Stamp

    Displays the day and time when the data was collected.

    Utilization(%)

    Displays the percentage of the port that was being utilized when the data was taken.

    Drop Events

    Displays the total number of events in which packets were dropped by the RMON probe due to lack of resources. This number is not necessarily the number of packets dropped, but is the number of times an overrun condition has been detected.

    Octets

    Displays the total number of octets of data received on the network.

    This number includes octets in bad packets.

    This number does not include framing bits but does include Frame Check Sequence (FCS) octets.

    Packets

    Displays the total number of packets received.

    This number includes bad packets, broadcast packets, and multicast packets.

    Packets: Broadcast

    Displays the total number of good packets received that were directed to the broadcast address.

    This number does not include multicast packets.

    Packets: Multicast

    Displays the total number of good packets received that were directed to a multicast address.

    This number does not include packets directed to the broadcast address.

    CRC Alignment Errors

    Displays the total number of packets received that were from 64 through 1518 octets long, but had either a bad FCS with an integral number of octets (FCS Error) or a bad FCS with a non-integral number of octets (Alignment Error).

    The packet length does not include framing bits but does include FCS octets.

    Size Packets: Under

    Displays the total number of packets received that were less than 64 octets long and were otherwise well formed.

    This number does not include framing bits but does include FCS octets.

    Size Packets: Over

    Displays the total number of packets received that were longer than 1518 octets and were otherwise well formed.

    This number does not include framing bits but does include FCS octets.

    Fragments

    Displays the total number of packets received that were less than 64 octets long and had either a bad FCS with an integral number of octets (FCS Error) or a bad FCS with a non-integral number of octets (Alignment Error).

    It is normal for this counter to be incremented, because it counts both runts (which are normal occurrences due to collisions) and noise hits.

    This number does not include framing bits but does include FCS octets.

    Jabbers

    Displays the total number of packets received that were longer than 1518 octets and had either a bad FCS with an integral number of octets (FCS Error) or a bad FCS with a non-integral number of octets (Alignment Error).

    Note: This definition of jabber is different from the definition in IEEE-802.3 section 8.2.1.5 (10BASE5) and section 10.3.1.4 (10BASE2). These documents define jabber as the condition where any packet exceeds 20 ms. The allowed range to detect jabber is between 20 ms and 150 ms.

    This number does not include framing bits but does include FCS octets.

    Collisions

    Displays the best estimate of the total number of collisions on this Ethernet segment.