Displaying RMON Ethernet statistics
RMON statistics provide count information on multicast and broadcast packets. This information includes total packets sent, undersized and oversized packets, CRC alignment errors, jabbers, collisions, fragments, and dropped events for each port on the system. RMON statistics collection is activated automatically during system startup, and requires no configuration.
To display RMON statistics, perform the following steps.
- Click Monitor on the left pane and select RMON.
- Click Statistic.
- Select a unit ID in the
Select Stack Unit ID
list and click
Display to view information about a specific stack unit.
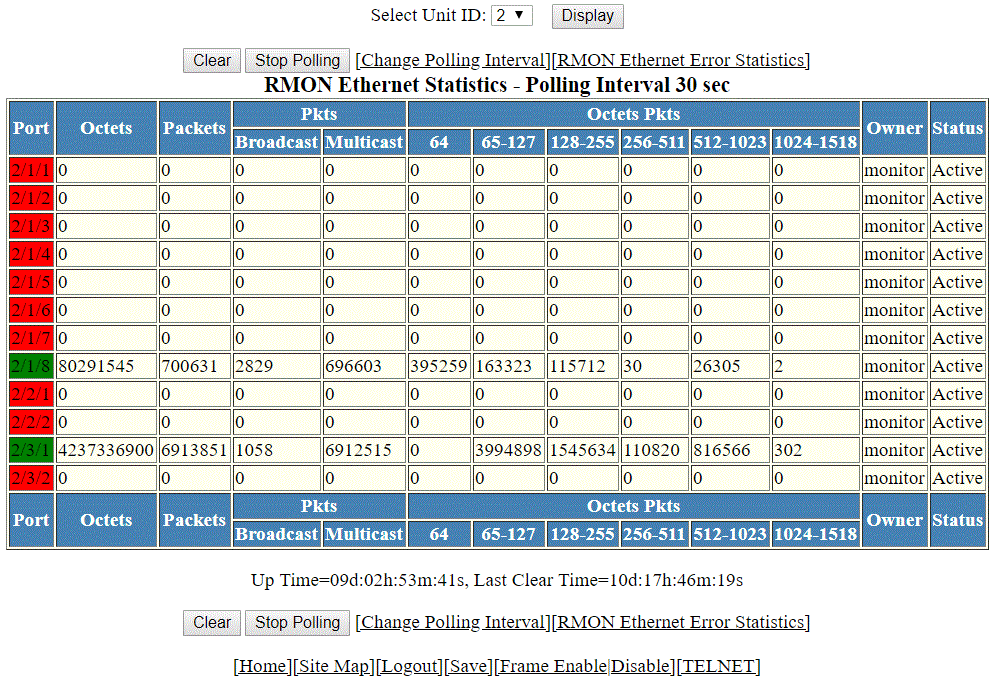
The RMON Ethernet Statistics window is displayed as shown in the figure below.
Description of the fields in the RMON Ethernet Statistics window
To remove the current data in the table and restart monitoring, click Clear. To stop reporting the statistics, click Stop Polling.
The RMON Ethernet Statistics window contains the following links:
- To change the polling interval, click Change Polling interval. For more information, refer to the “Changing polling interval” section.
- To display the RMON Ethernet error statistics, click RMON Ethernet Error Statistics. For more information, refer to the “Displaying RMON Ethernet error statistics” section.