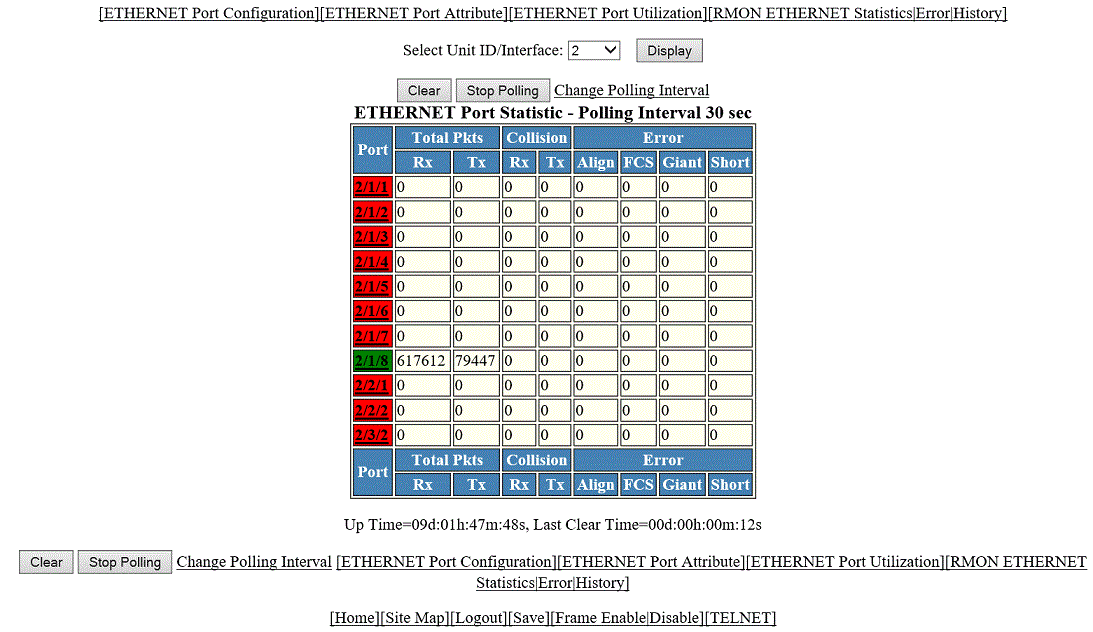
Displaying Ethernet port statistics
The ETHERNET Port Statistic window lists the total number of packets, number of collisions, and number of errors that have occurred on a port. To display the Ethernet port statistics, perform the following steps.
- Click Monitor on the left pane and select Port.
- Click Statistic and then select Ethernet.
- Select a
unit ID in the
Select Stack Unit ID/Interface list and click
Display to view information about a specific stack unit.
Description of the fields in the ETHERNET Port Statistic window
To remove the current data and restart the monitoring process, click Clear. To stop the polling process, click Stop Polling. You can also change the current polling interval by clicking Change Polling Interval.
The ETHERNET Port Statistic window provides links to configure the port parameters:
- To configure an Ethernet port, click ETHERNET Port Configuration. For more information on how to configure an Ethernet port, refer to the “Configuring an Ethernet port” section.
- To monitor the Ethernet port attributes, click ETHERNET Port Attribute. For more information, refer to the “Displaying Ethernet port attributes” section.
- To monitor the Ethernet port utilization, click ETHERNET Port Utilization. For more information, refer to the “Displaying Ethernet port utilization” section.
- To monitor Remote Monitoring (RMON) Ethernet statistics, click RMON ETHERNET Statistics Error. For more information, refer to the “Displaying RMON Ethernet statistics” section.
- To monitor RMON history, click RMON ETHERNET Statistics History. For more information, refer to the “Displaying RMON history” section.