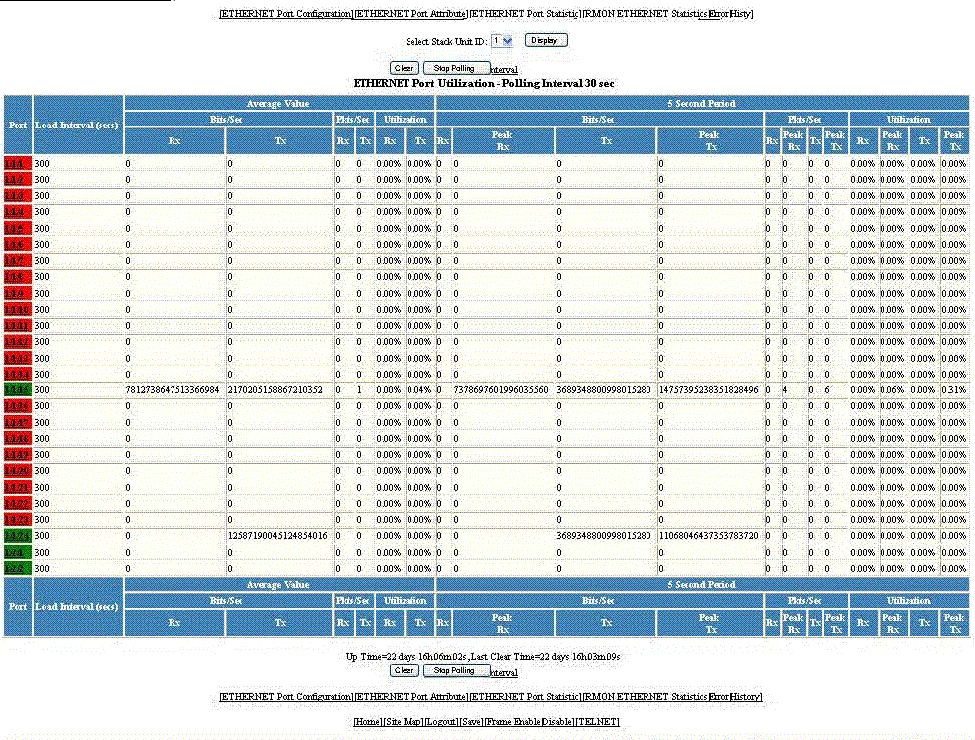
Displaying Ethernet port utilization
The ETHERNET Port Utilization window lists the traffic that is received and transmitted on a port. To display the Ethernet port utilization information, perform the following steps.
- Click Monitor on the left pane and select Port.
- Click Utilization and then select Ethernet.
- Select a unit ID in the
Select Stack Unit ID list and click
Display
to view information about a specific stack unit.
Description of the fields in the ETHERNET Port Utilization window
To remove the current data and restart the monitoring process, click Clear . To stop the statistics polling process, click Stop Polling. You can also change the current polling interval by clicking Change Polling Interval .
The ETHERNET Port Utilization window provides links to configure the port parameters:
- To configure an Ethernet port, click ETHERNET Port Configuration. For more information on how to configure an Ethernet port, refer to Configuring an Ethernet port.
- To monitor the Ethernet port attributes, click ETHERNET Port Attribute. For more information, refer to the “Displaying Ethernet port attributes” section.
- To monitor the Ethernet port statistics, click ETHERNET Port Statistic. For more information, refer to the “Displaying Ethernet port statistics” section.
- To monitor Remote Monitoring (RMON) statistics, click RMON ETHERNET Statistics Error. For more information, refer to the “Displaying RMON Ethernet statistics” section.
- To monitor RMON history, click RMON ETHERNET Statistics History . For more information, refer to the “Displaying RMON history” section.