Navigating the Dashboard
The RUCKUS Unleashed dashboard is the primary interface used for monitoring and configuring all aspects of your network. The RUCKUS Unleashed dashboard is divided into three main sections as described in the following table.
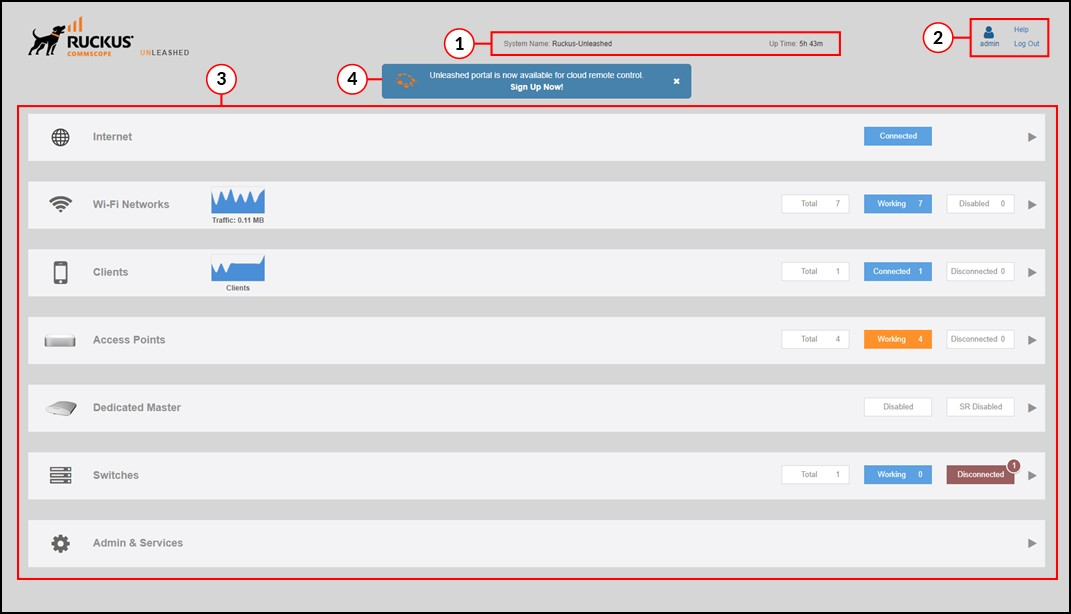
Dashboard Sections
| Number | Component | Description |
|---|---|---|
| 1 | System Name and Uptime | Displays the system name that you configured and the uptime since the last reboot. |
| 2 | Admin Info | Displays currently logged-in Admin name and a link to this Online Help. |
| 3 | Dashboard Components | Provide general overview of each component. Click any of the components to expand for more detailed information and configuration options. Refer to Using the Dashboard Components. |
| 4 | Signup popup | Click Sign Up Now! to log in to the remote portal. Refer to Remote Portal Support for more information. |