Access Points Configuration Overview
The Access Points component on the dashboard presents an overview of the connected and disconnected APs that are recognized by this RUCKUS Unleashed network.
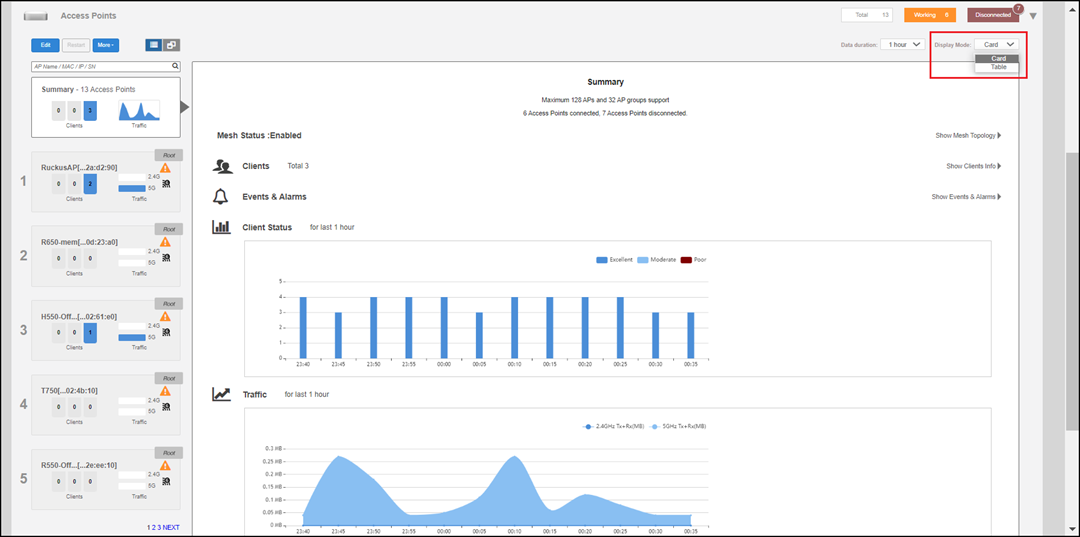
The Access Points component offers two display modes:
The Access Points component offers the following options:
- Summary AP box: Click this box to view a summary of all AP clients, signal quality, and traffic statistics.
- Individual AP boxes: Click any of these boxes to view details specific to the indicated AP.
- View mode: Switch between AP and AP Group views. AP mode lets you view and configure APs individually, while AP Group mode lets you create and manage AP groups. For more information, refer to Working with AP Groups.
- Data Duration: Select the duration of time interval (10 minute, 1 hour, and 12 hours) to view the client status and traffic information of the indicated WLAN.
- Display Mode: Switch
between card and table display modes. If there are more than 20 APs or AP groups,
they are displayed in table mode automatically. The display mode returns to the
default (card mode) when the web interface is refreshed.
Note: You can configure 32 AP groups in Dedicated mode and 10 AP groups in local bridge mode from the web interface, CLI, and mobile app.
- Search field: Search AP or AP groups in card or table display mode.
- Sort: Sort items with Device Name, Clients, Mac Address, Model, SN, Version in AP page and Group Name, APs, Clients, WLANs in AP group name.
- Show Mesh Topology: Click this link to view the Mesh topology.
- Show Clients Info: Click this link to view a table of currently connected clients.
- Show Events & Alarms: Click this link to view a table of events and alarms.
- Client Status bar chart: This chart displays the number of connected clients and the client signal quality across all connected APs at one-minute intervals (over the last 10 minutes).
- Traffic graph: This graph displays the Received (Rx), Transmitted (Tx), and Total traffic values as per the time interval selected for Data Duration.
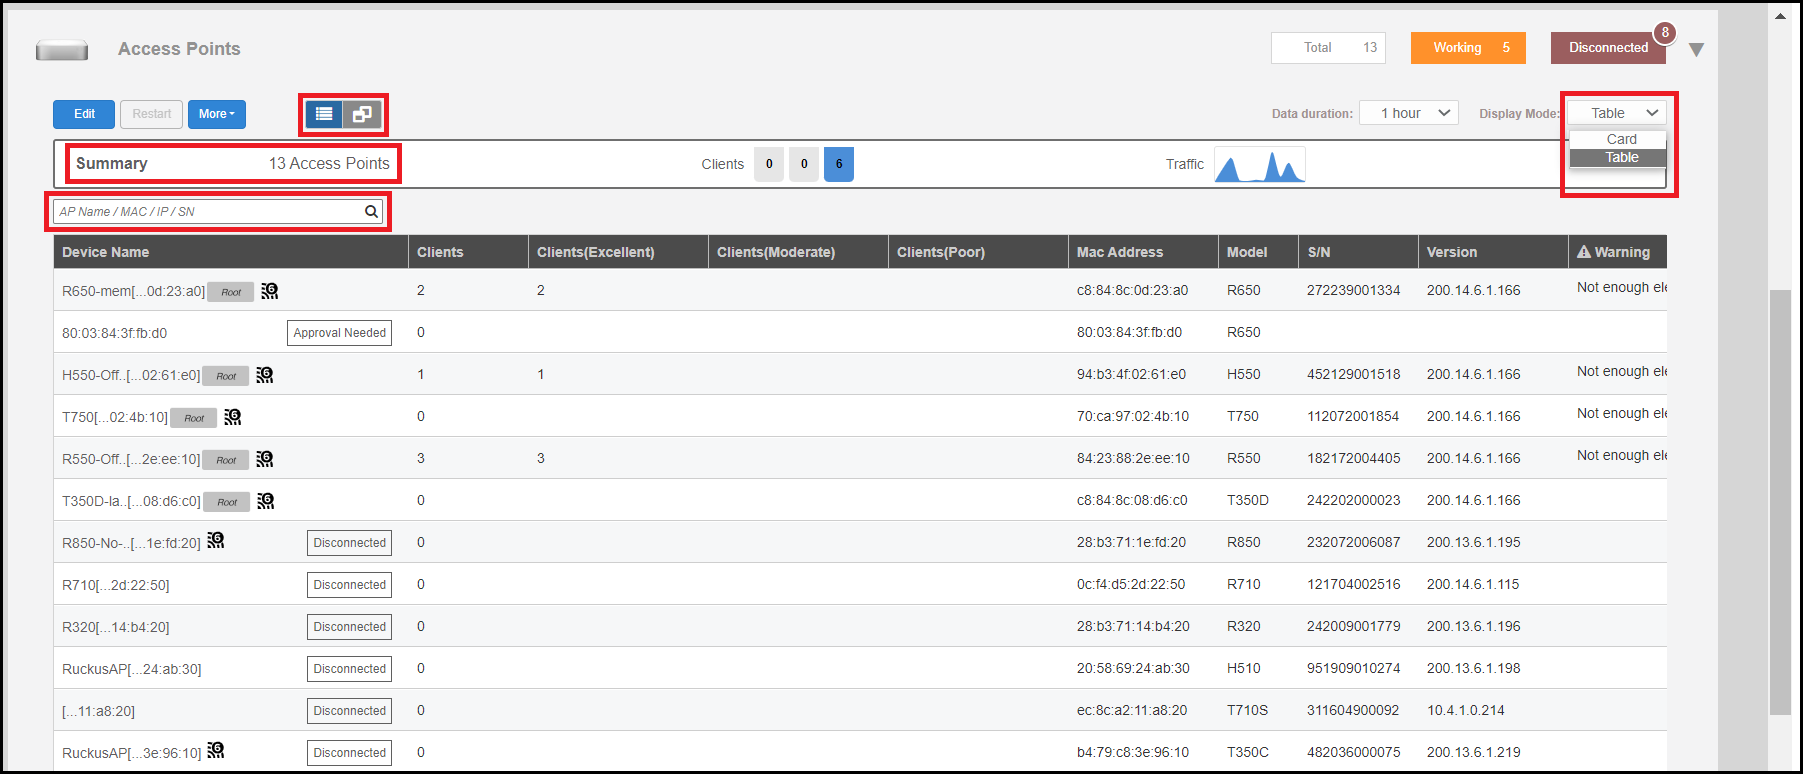
You can sort the items in the table by clicking the Device Name, Clients, Mac Address, Model, SN, and Version column headings for APs, and the Group Name, APs, Clients, and WLANs column headings for AP groups.
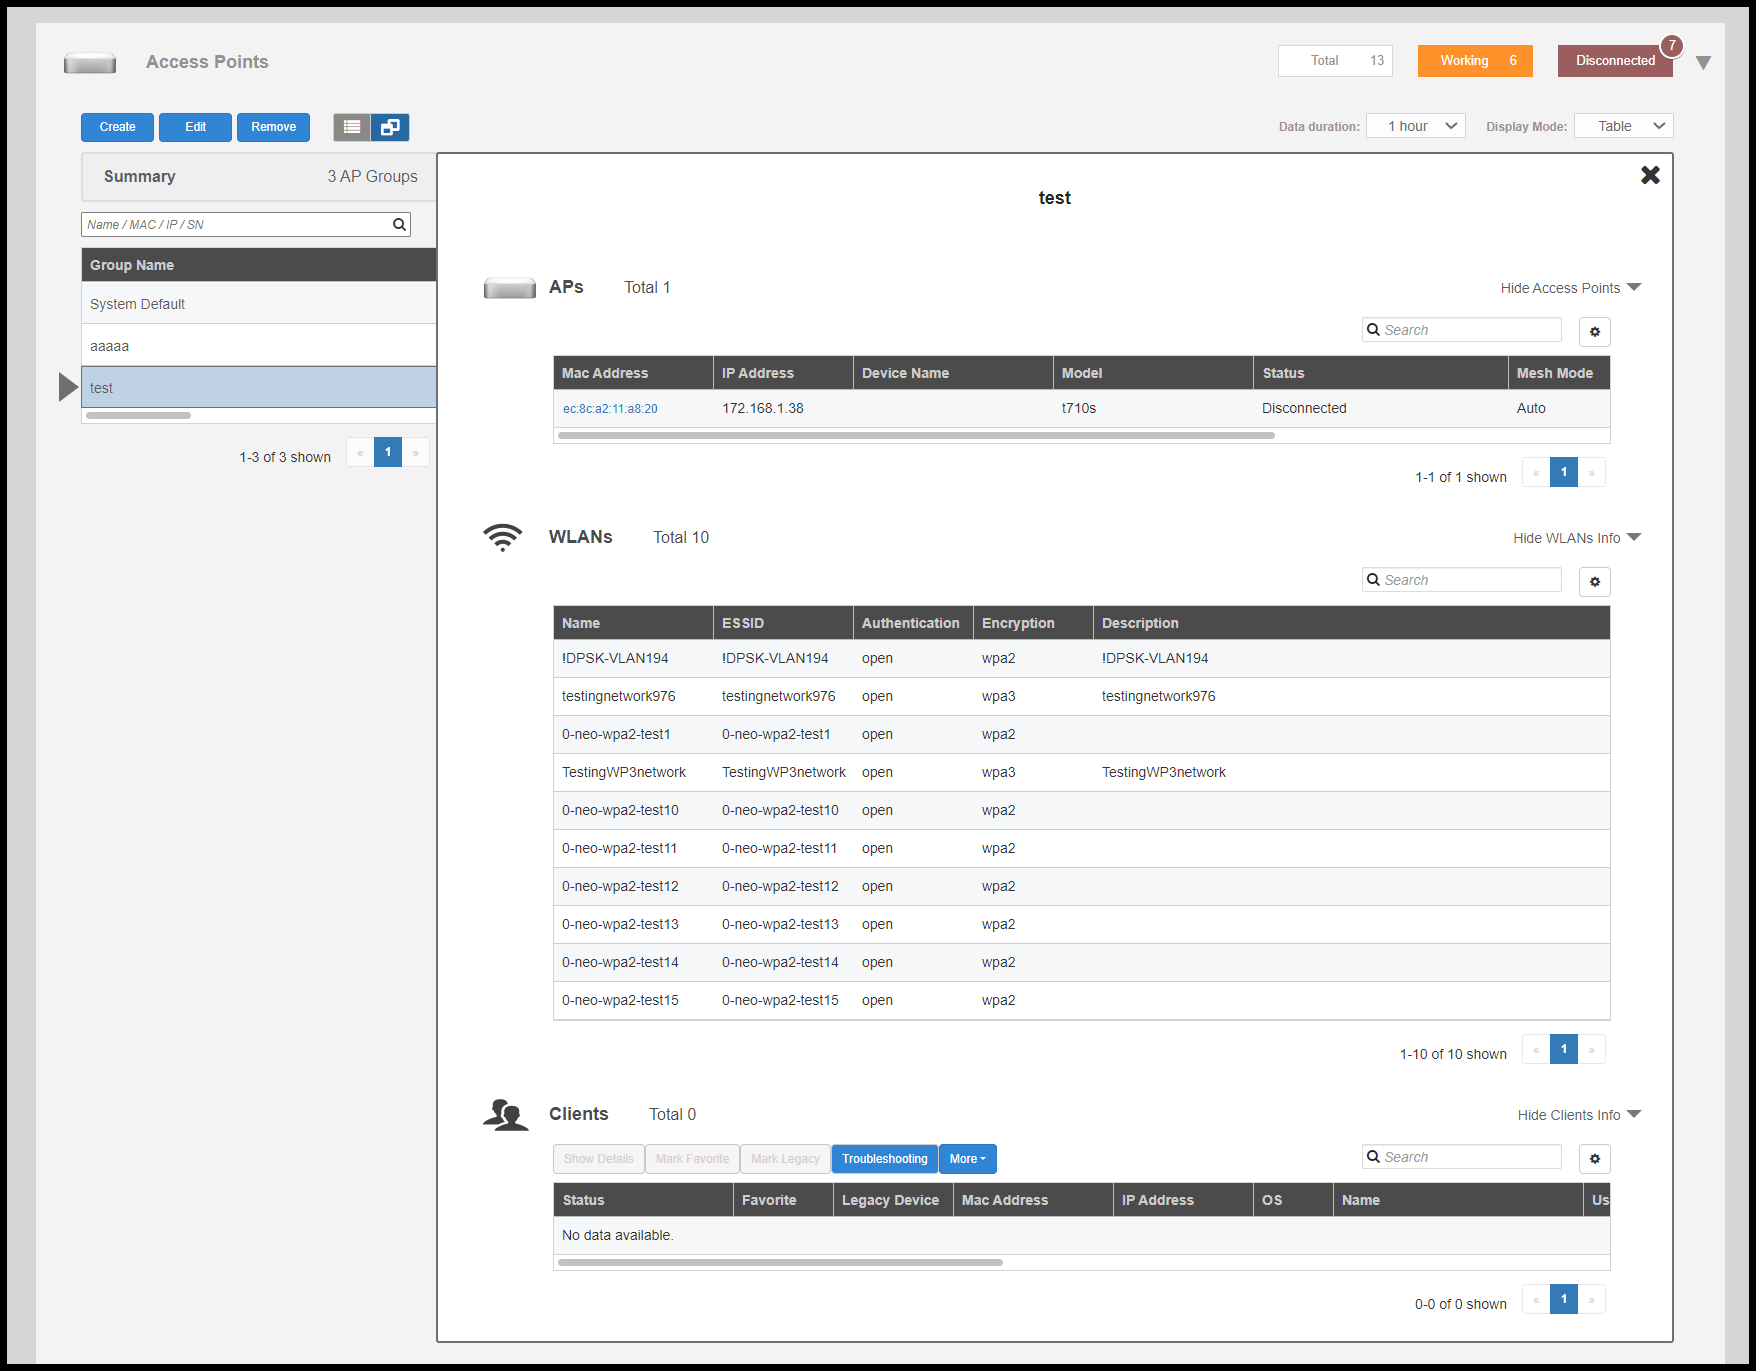
In the table display mode and group view mode, you can click individual rows to view information about the APs, WLANs, and clients associated with the selected AP group.