Wireless Dashboard
The Wireless Dashboard offers an overview of different network indicators. It consists of the following tabs that will be explained in more detail below:
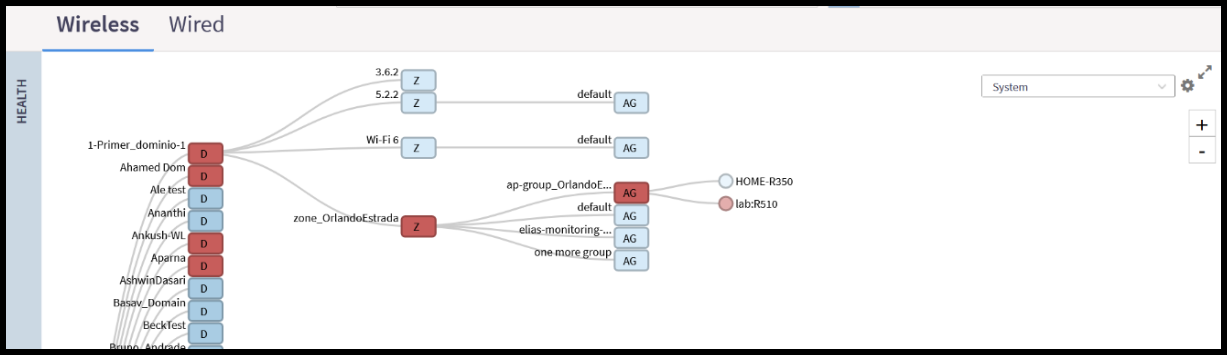
The Health tab provides administrators with an overall summary of Access Point (AP) statuses, including Flagged, Offline and Paging (Paging indicates there are more network items grouped within). Network items are displayed hierarchically, showing top-level Domains and Zones. The display is interactive, allowing you to click on any Domain or Zone to reveal the next leg of that specific hierarchy path. Additionally, an optional map view integrates with Google Maps to display the geographical locations of network items worldwide.
To simplify the graphics displayed in the Health tab and the other tabs, views can be narrowed down to specific Domains or Zones. Use the search bar in the upper-right corner of the Health tab to select the hierarchical area of interest. The search bar will reflect the currently selected domain view.
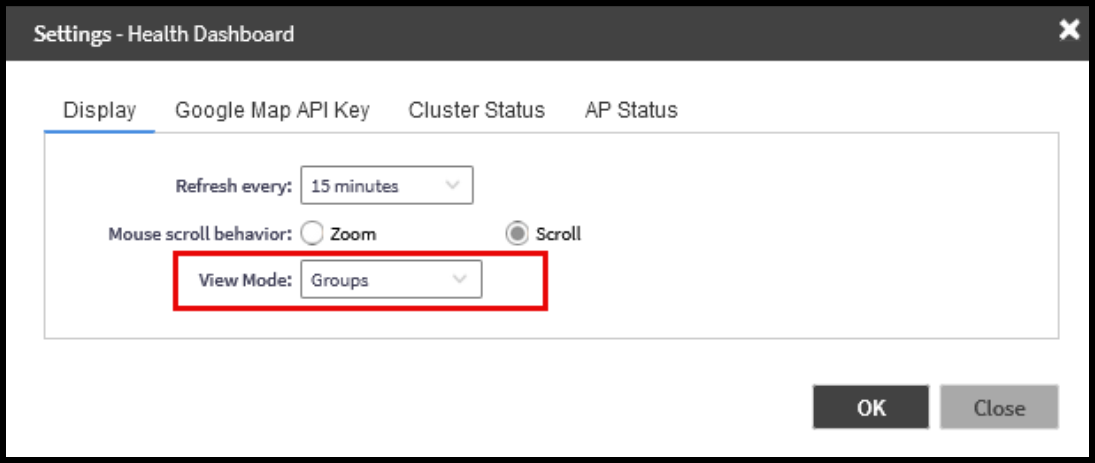
Using the gear icon, the administrator can open the Health Dashboard settings where view mode options are available and additional customization options for the thresholds for the status indicators of the APs and Cluster can be found. The Health tab on the Dashboard can be organized in different views including Map, Ball, Groups, Control Planes, and Data Planes.
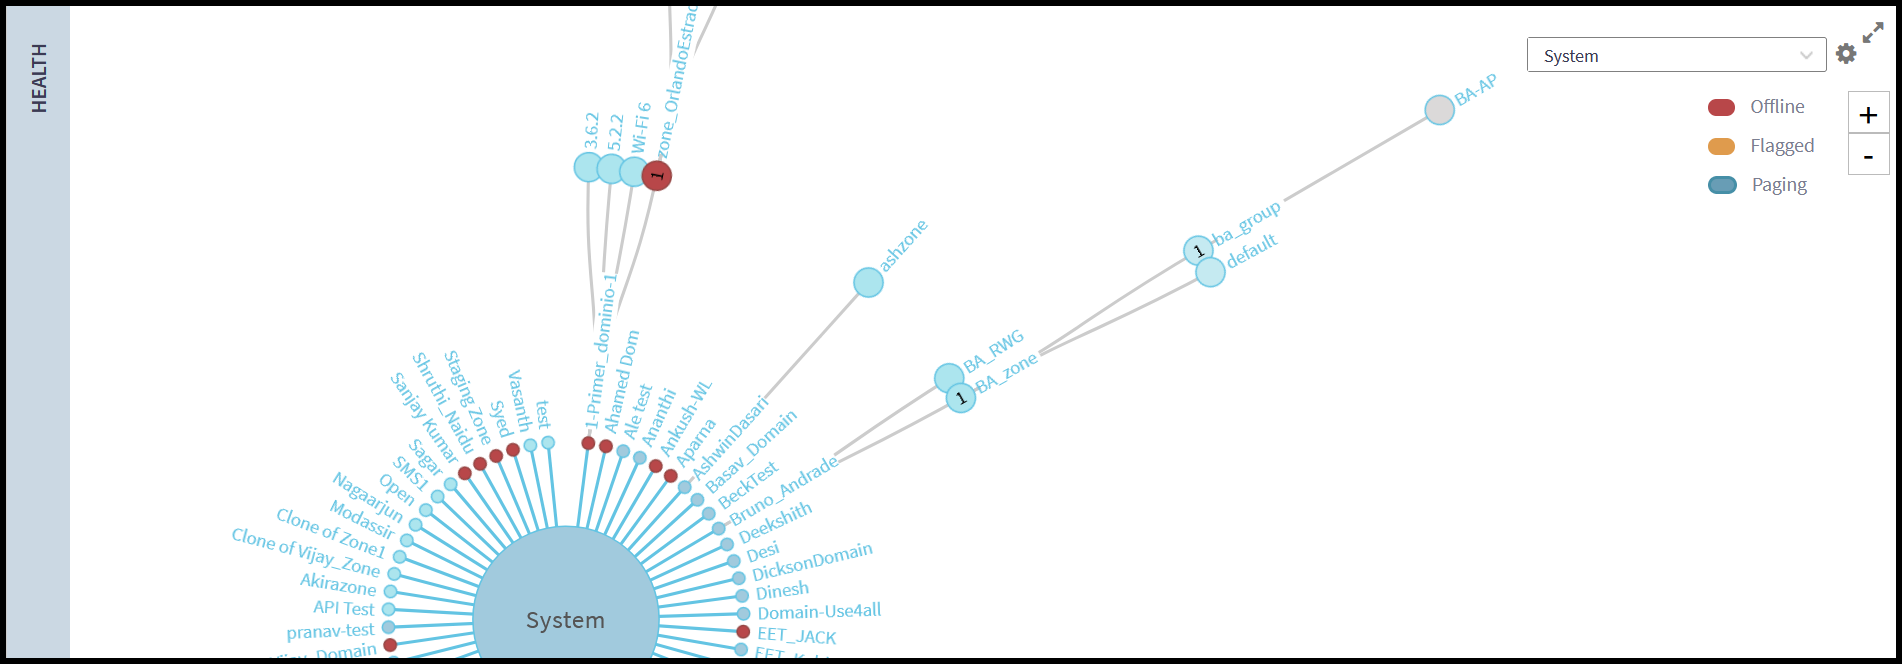
Note: Refer to RUCKUS SmartZone Network Administration Guide for detailed steps on importing and configuring a floor map.
The Performance tab offers insights into Latency, Airtime Utilization, and AP Capacity statistics collected over the last hour or the past 24 hours as per the selected hierarchical filter in the Health tab. The interactive time-series chart provides a graphical representation of median, likely range, and minimum and maximum performance values for the top 10 APs for a specific radio band (selectable using the drop-down menu).You can configure the number of APs for which data is aggregated and the label used for each AP (name, MAC, or IP address) by clicking the gear icon. You can selectively show or hide the data for any value type by clicking on the interactive, color-coded, value name in the key above the graph. On the time-series graph, you can view time-specific details by clicking on or hovering your cursor over a specific data point.
Note: Refer to RUCKUS SmartZone Network Administration Guide for detailed information about the different flags in the Access Points and the meaning of the indicators seen in the Tooltip.
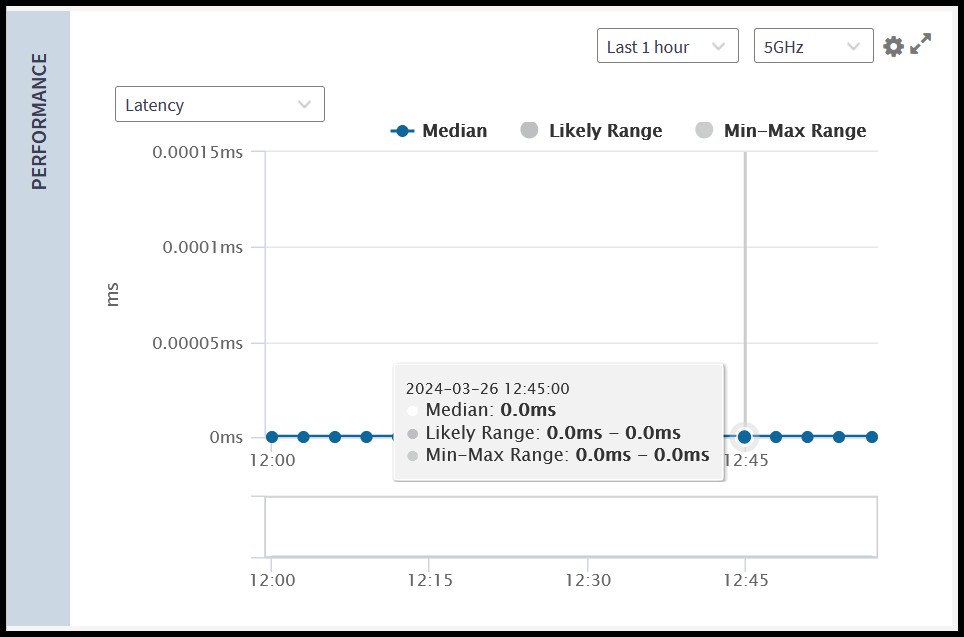
Note: Refer to RUCKUS SmartZone Network Administration Guide for detailed information about the meaning and calculation of the different performance indicators seen in this tab.
The Connection Failure tab provides a time-series graph reflecting statistics collected over the last hour or the past 24 hours related to wireless client connection failures as per the selected hierarchical filter in the Health tab. It allows the administrator to visualize these failures either in total or by type, including Authentication, Association, EAP, RADIUS, DHCP, and User Authentication.
Additionally, this information can be filtered by radio band or view the total across all radio bands. You can configure the number of APs for which data is aggregated and the identifier used for each AP (name, MAC, or IP address) by clicking the gear icon.
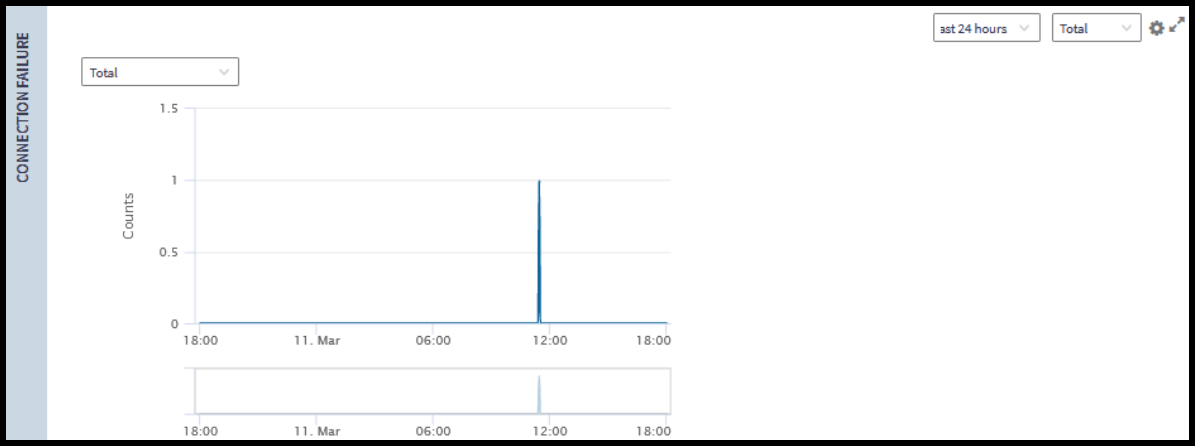
Note: Refer to the RUCKUS SmartZone Network Administration Guide for detailed information about the meaning and calculation of the different connection failure indicators seen in this tab.
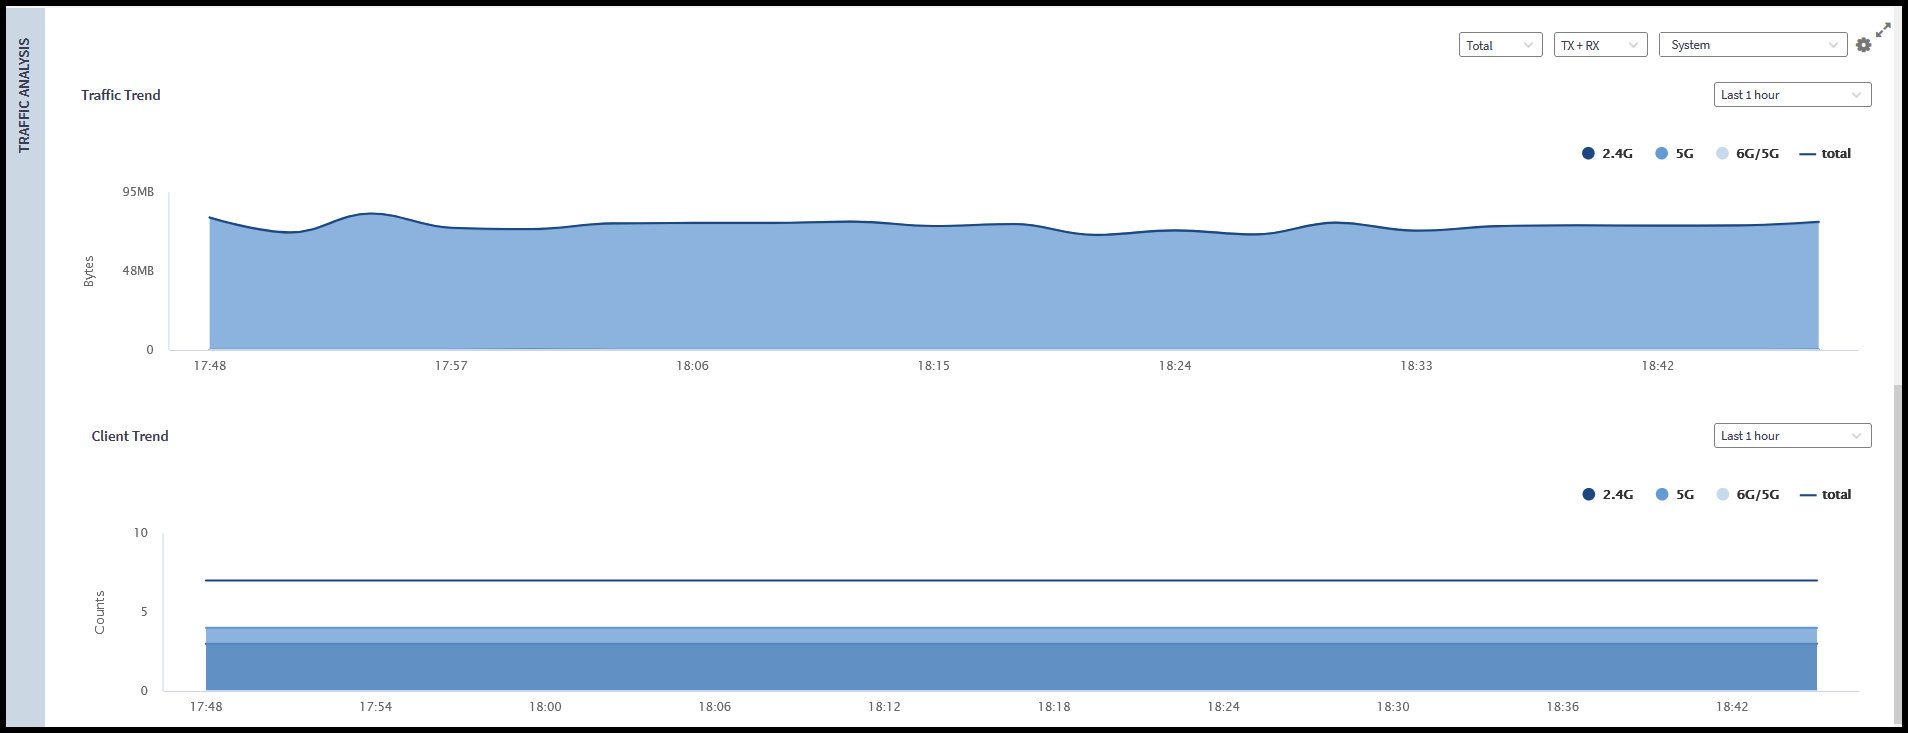
The Traffic Analysis tab provides administrators with a graphical view to understand and compare transmitted and received traffic trends over the last hour or the past 24 hours. The interactive time-series charts provide a graphical representation of traffic trends per-band or in total (selectable using the drop-down menu). If Total is selected, you can selectively show or hide the data for any radio band by clicking on the interactive, color-coded, band name in the key above the graph.
You can also filter the view by traffic type (TX, RX, or both) and by specific hierarchical items (such as Domain or AP Zone). For each graph, you can selectively show or hide the data for any value type by clicking on the interactive, color-coded, value name in the key above the graph.
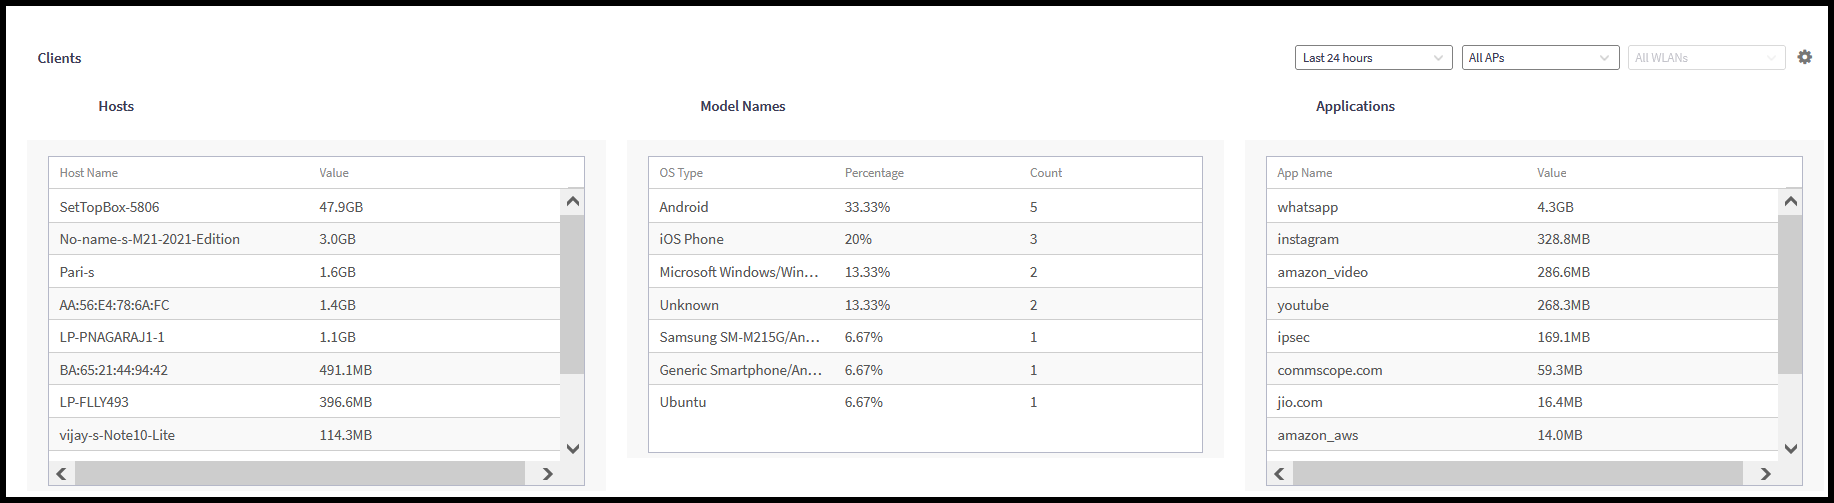
Also, you can view time-specific details by clicking on or hovering your cursor over a specific data point. Furthermore, it showcases traffic trends based on individual hosts, OS types, and applications.
The Clients section displays, by default, the top 10 hosts, OS types, and applications, in Chart format, showing the client names. These settings are configurable to change to a table view and to change the client labeling to MAC or IP address.