Wired Dashboard
The Wired Dashboard provides an overview of switch status, traffic trends, port errors, and PoE utilization. It is divided into two main tabs: the Health Tab and the Traffic Analysis Tab.
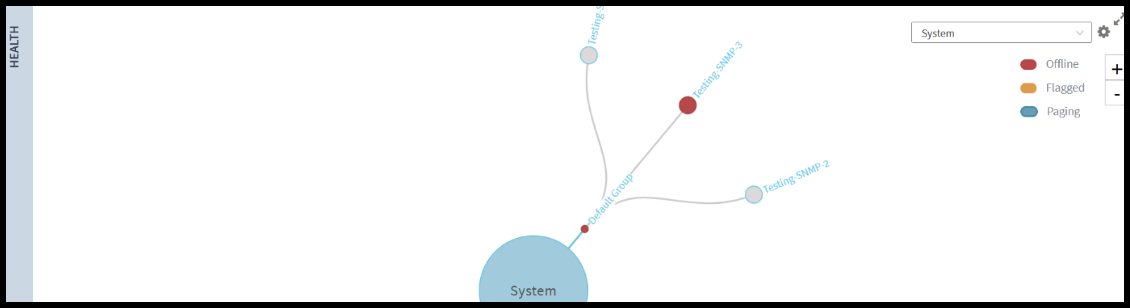
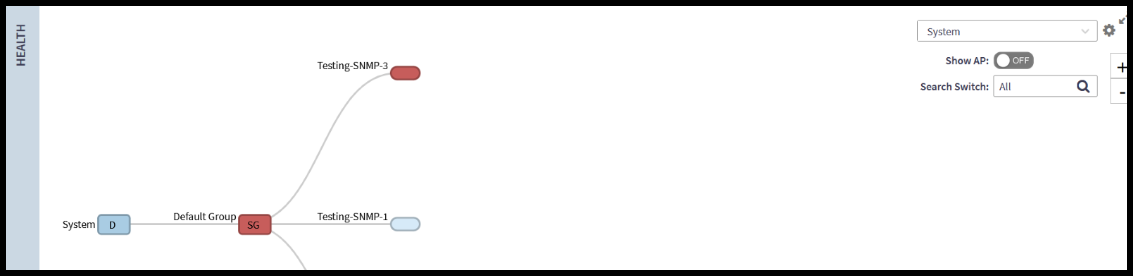
The Health tab provides an overall summary of switch statuses, including Flagged, Offline, and Paging (Paging indicates there are more network items grouped within). Network items are displayed hierarchically, showing top-level Domains and Switch Groups. The display is interactive, allowing you to click on any Domain or Switch Group to reveal the next leg of that specific hierarchy path.
To simplify the graphics displayed in the Health tab, views can be narrowed down to specific Domains or Switch Groups. Use the drop-down menu in the upper-right corner of the Health tab to select the hierarchical area of interest. The currently selected hierarchy level appears highlighted.
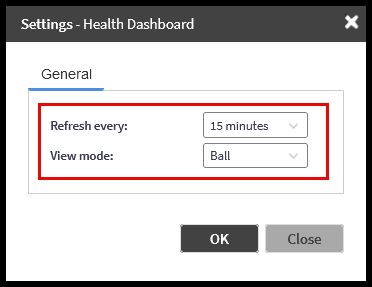
This tab offers two modes of view: Topology and Ball (the default setting). Use the gear icon in the upper-right corner of this tab to select the view mode and the refresh interval. The refresh interval defaults to every 15 minutes.
The topology view offers the option to include in the chart the APs connected to the switches, if any. Switch the Show AP toggle to ON to search for and display APs connected to the switches.
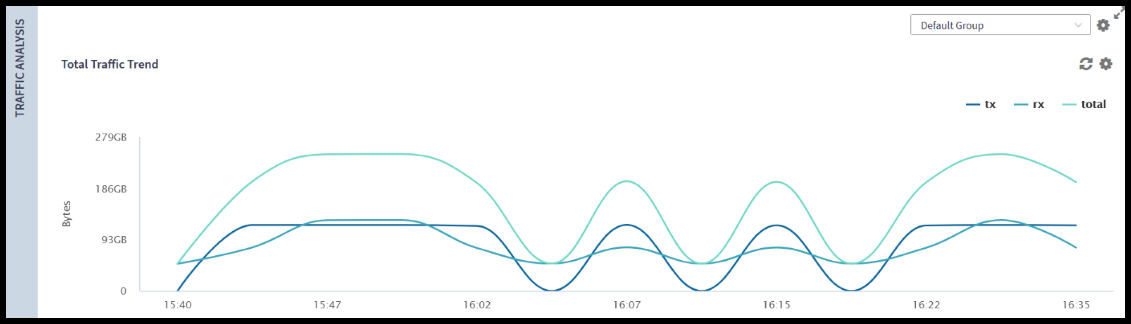
The Traffic Analysis tab consists of different charts that can also be displayed in a table view, including the Total Traffic Trend. Use the drop-down menu to narrow down the content to specific Switch Groups.Clicking each interactive, color-coded, value name (tx, rx, and total) in the key above the graph will select or unselect the information displayed in the chart. You can customize the scope and display of the Total Traffic Trend data, including the system hierarchy level, the refresh interval, and the table/chart display options.
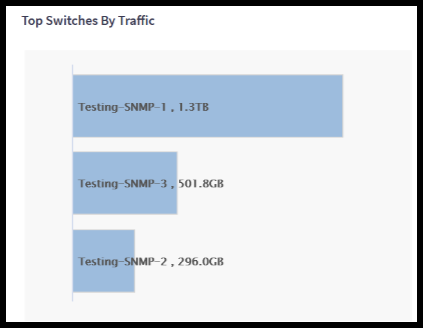
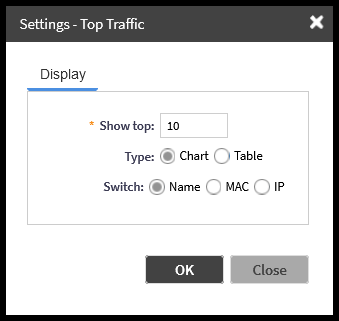
Additionally, the Traffic Analysis tab contains charts displaying switches categorized by most traffic throughput, most port errors, and highest PoE utilization. You can customize the scope and display of the Top Switches By Traffic data, including the number of switches for which data is displayed (minimum number is three), the view type (table or chart), and the identifier used for each switch (name, MAC, or IP address). The Top Switches By Port Error and Top Switches By PoE Utilization (watt) charts are displayed as bar charts only.