Getting to Know the Dashboard
After you log in to Unleashed Multi-Site Manager, the Dashboard is the first page that is displayed. The Dashboard provides a quick summary of what is happening on Unleashed Multi-Site Manager and its managed devices providing a starting point for network administrators seeking specific information and issues that may require attention.
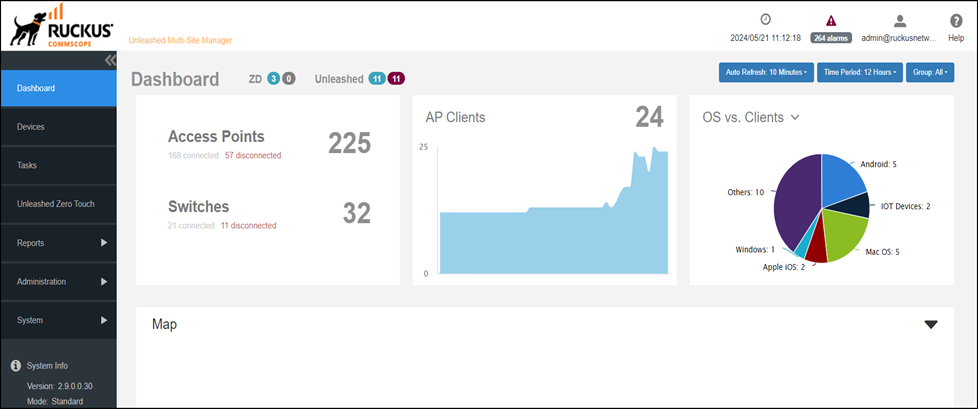
The Auto Refresh, Time Period, and Group filters are available in the upper-right corner of the Content panel, allowing you to control the data displayed on the Dashboard.The Auto Refresh menu allows you to select the time interval for the page to refresh automatically and display the latest information. Options include refreshing every 10, 20, or 30 minutes, or disabling the functionality completely. The Time Period menu allows you to select the period of time for which data must be displayed in the Dashboard. You have the option to select 12 hours, 24 hours, 7 days, or 3 months. The Group menu allows you to select the data you want to display on the Dashboard. You can select All or select any specific device group.
The Dashboard displays at-a-glance information about the following managed devices:
- The number of connected and disconnected ZoneDirector and Unleashed devices (when the Group filter is set to All)..
- The number of connected and disconnected switches.
- The number of APs that are registered with ZoneDirector
and Unleashed controllers (which, in turn, are being managed by Unleashed Multi-Site Manager).
UMM 2.2 update
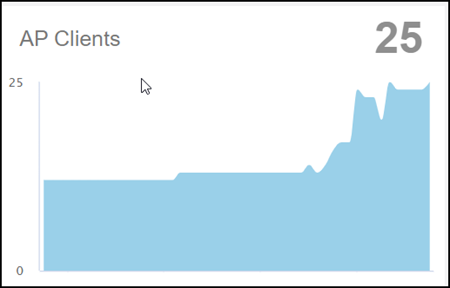
The number of AP clients that are associated with the currently connected APs are displayed. Pause the pointer along the graph to display the connected clients at any time within the selected time range. The graph displays the number of connected AP clients depending on the time period option selected. For example, if you select 12 hours, then the graph displays trends for devices connected for the last 12 hours.
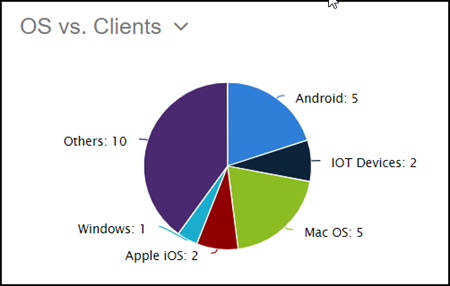
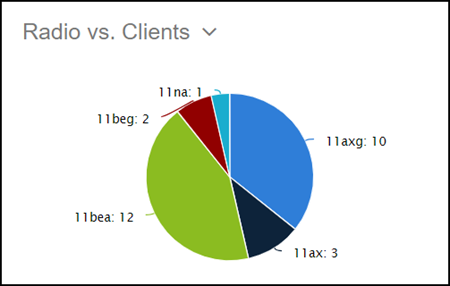
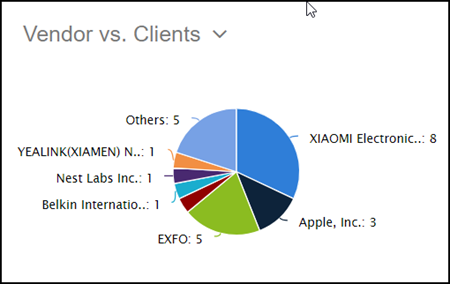
- The Clients chart displays a donut chart of wireless clients distribution based on your selection of operating system, radio, or vendor. Pause the pointer over the chart for more information. For example, if you pause the pointer over the OS vs. Clients chart, is displays that 25% of the clients are iOS OS users.
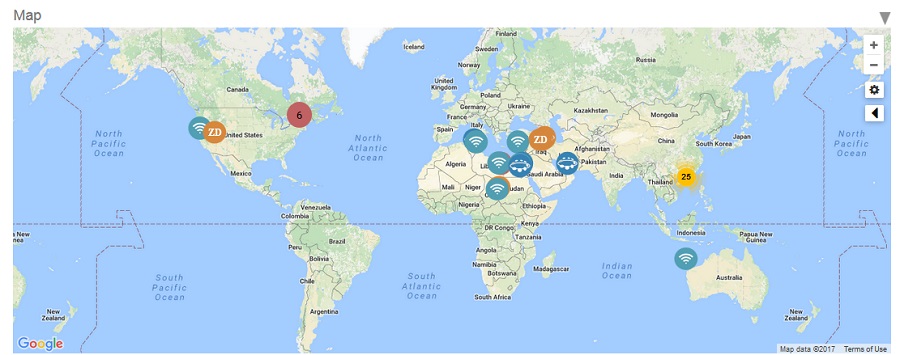
- A map which displays the AP and device information
across the globe. Pause the pointer on the AP, switch, or device to see the
respective statistics.
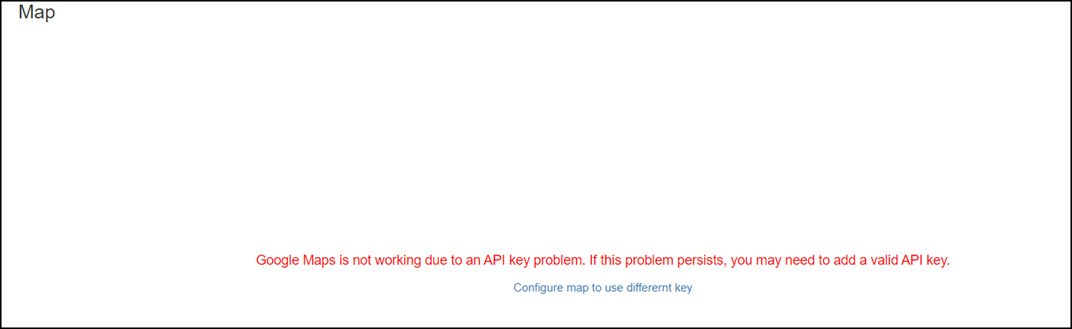
You will see the below message when the map does not appear due to API key problem.
"Google Maps is not working due to an API key problem. If this problem persists, you may need to add a valid API key.
Configure map to use different key".
- The Recent Events tab displays information about events that have occurred on
Unleashed Multi-Site
Manager, as well as on managed ZoneDirector and Unleashed platforms, and the
associated devices and clients.
The following table describes the information that you can find on the Recent Events tab.
Columns on the Recent Events Tab
The information displayed in the Recent Events tab can be customized:
- The Alarms tab displays
information about alarms that have occurred on Unleashed Multi-Site
Manager, on managed ZoneDirector, Unleashed devices, ICX switches and on
clients.
The following table describes the information that you can find on the Alarms tab.
Columns on the Alarms Tab
Column Name Description Time Displays the alarm time stamp. Severity Displays the severity of the alarm such as Warning, Minor, Major, and Critical. Device Name Name of device reporting the alarm. Click this link to go to the devices reporting the specific alarm. Alarm Type Displays the type of alarm such as AP traffic, number of channel changes, and so on. Activity Description of the issue that triggered the alarm. The display of information in the Alarms tab can be customized:
- Use the Severity drop-down menu in the top-right corner of the panel to display alarms based on the severity (All, Warning, Major, Minor, and Critical).
- Use the gear icon in the top-right corner of the panel to change the number of rows displayed per page and change which table columns are displayed.
- Click on any column header to reorder the table rows per the data in that column.