Event Configuration
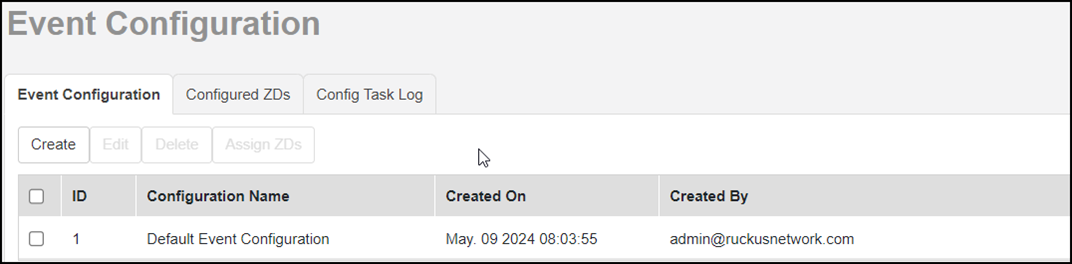
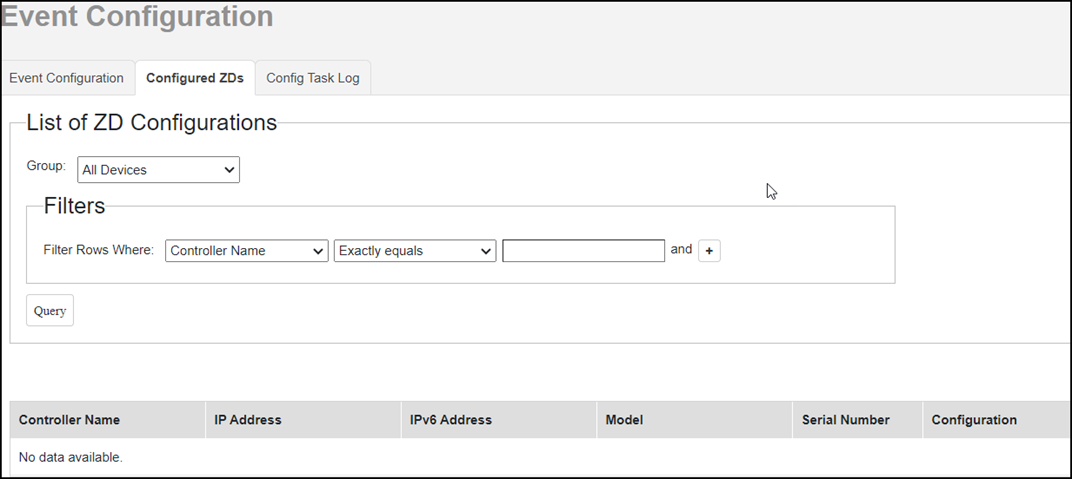
The Event Configuration tab list all the configured events. The Configured ZDs tab displays all existing Zone Director devices. You can filter the displayed output based on the selection you make from the Select a ZD view drop-down. This can be further filtered by creating a raw based filter query based on IP Address, IPV6 Address, Controller name, Model, and Serial Number.
Multiple filter queries can be clubbed by clicking the "+" sign against each query row. Once all your filter queries are entered, click the Query button on the bottom right corner of the page to run the query and fetch the result. The result is displayed in the List of ZDs section.
To create a new event configuration, click the Create a New Event Configuration button. The page gets refreshed to display the New Event Configuration section.
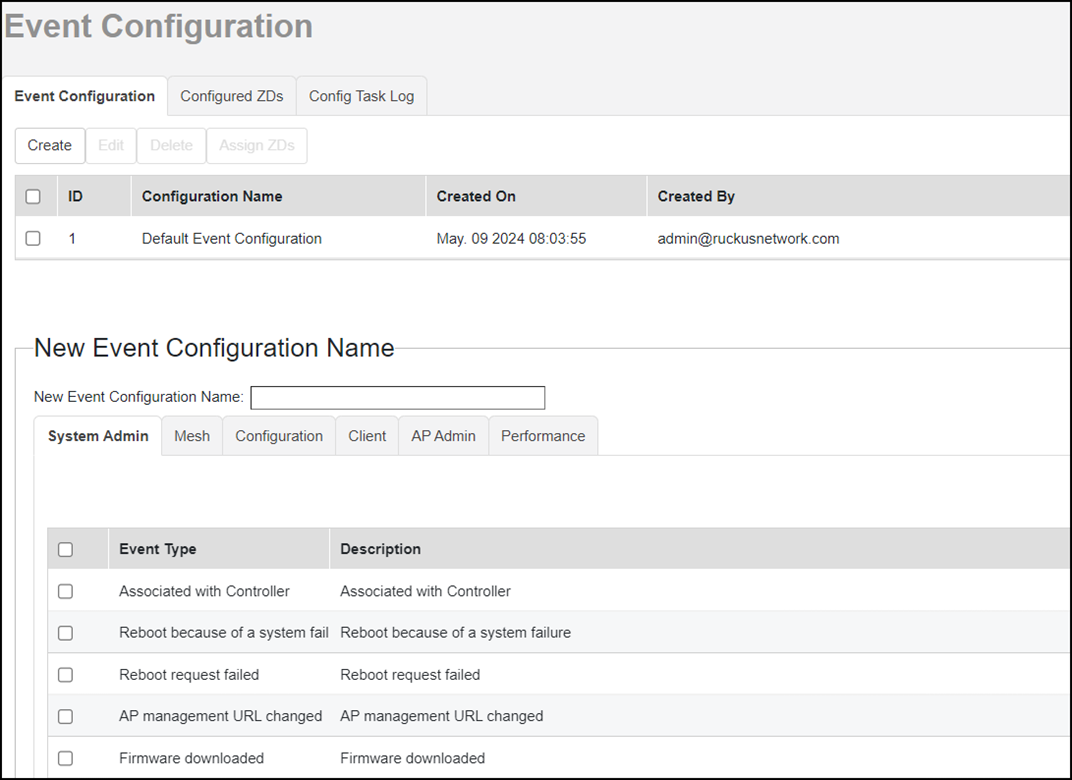
Enter a name for the configuration in the New Event Configuration Name text field. All available event types are calcified under the System Admin, Mesh, Configuration, Client, AP Admin and Performance tabs. Make selections as required under these tabs and click the Save button on the bottom right corner of the page, to save the new configuration. The newly created configuration will now appear under the Event Configuration tab.
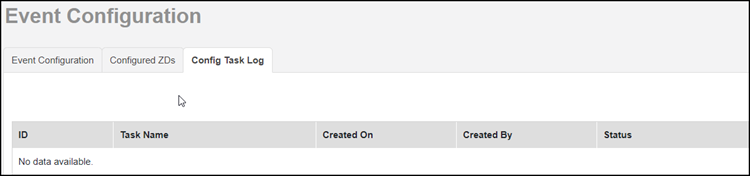
The list of task logs is displayed under the Config Task Log tab.