The Dashboard, which is the first page that appears after you log in to the Web
Management Interface (Main UI), provides a snapshot of the current details for the
ICX
device or group of ICX devices connected together. The Dashboard provides a centralized monitoring pane for the ICX device and
displays the operational status and statistics.
Note: The figures included in this guide for illustrative purposes
only. The ports panel and port speed vary with different ICX models.
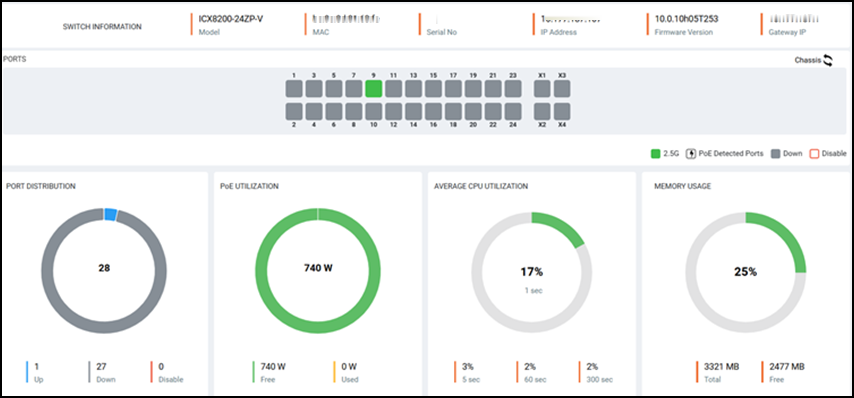
By default, the Dashboard displays the Ports panel. In the upper-right corner of the
panel, click Chassis to switch to
the Chassis panel and click Ports
to switch to the Ports panel.
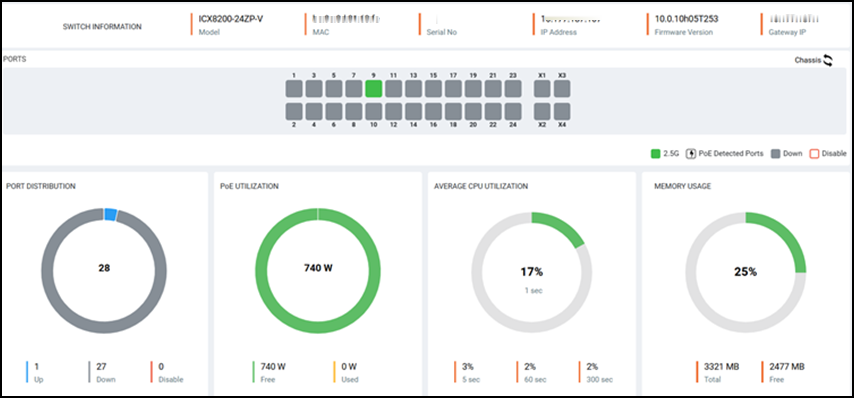
Dashboard: Ports Panel
Dashboard: Chassis Panel
The following table lists the infographic elements
of the Dashboard that provide the basic device
information and its operational status and statistics.
Dashboard Elements
Dashboard Element
Description
SWITCH INFORMATION
Displays the following device information:
Model: Displays the ICX
model details.
MAC: Displays the MAC
address of the device.
Serial No: Displays the
serial number of the device.
IP Address: Displays the IP
address which is used to access the device by way of web
management.
Firmware Version: Displays
the firmware version number.
Gateway IP: Displays the
gateway IP address.
STACK
Appears only when the ICX devices are in a stack configuration
and displays the total number of units in the stack.
The numbers displayed
within each color-coded box indicate the unit IDs.
The color code
represents the role of each unit:
Green:
Represents an active unit.
Blue:
Represents a member unit.
Red:
Represents a standby unit.
PORTS
Displays the ports in a unit and their capabilities.
The number above or
below each port indicates the port number.
The color code
represents different port speeds; all visible color coding is
defined in the bottom-right corner of the PORTS panel.
The icon on the ports indicates detected
Power over Ethernet (PoE) ports.
CHASSIS
Displays the following chassis information:
Power Supply:
Displays the total number of power supply connectors and
their status. The following color code represents their
status:
Green: Power supply is up.
Grey:
Power supply is not present.
Red:
Power supply failure.
The
icon on the ports
indicates detected Power over Ethernet (PoE) ports.
Fan Status:
Displays the total number of cooling fans and their status.
The following color code represents their status:
Green: Fan is up.
Grey:
Fan is not present.
Red:
Fan is failure.
Note:
If a fan is not present, the fan status will be "NO
FAN".
Temperature:
Displays the current internal temperature of the chassis. The
following color code indicates the thermal health of the
device:
Green:
Temperature is within the normal operating range.
Orange:
Temperature has reached the warning level.
Yellow:
Temperature has reached the shutdown level.
PORT DISTRIBUTION
Displays the total number of ports per unit; also displays the
breakdown of the port count based on the operational status (up, down,
and disable).
PoE UTILIZATION
Displays the total number of watts available for consumption;
also displays the breakdown of consumed and free power per unit.
AVERAGE CPU UTILIZATION
Displays the percentage of CPU being used by the device at
5-second, 1-minute, and 300-second intervals.
MEMORY USAGE
Displays the percentage of total memory currently in use; also
displays (in megabytes) the total amount of dynamic memory and the
remaining amount of free memory.
 icon on the ports indicates detected
Power over Ethernet (PoE) ports.
icon on the ports indicates detected
Power over Ethernet (PoE) ports.