Managing Syslog Messages
You can configure the logging host (syslog
server) to which syslogs are sent. Events that are logged by the device can be viewed
and
downloaded for debugging and troubleshooting purposes.
Complete the following steps to configure the logging host and view and download the syslog messages.
- From the main menu, select
. You can perform the following actions:
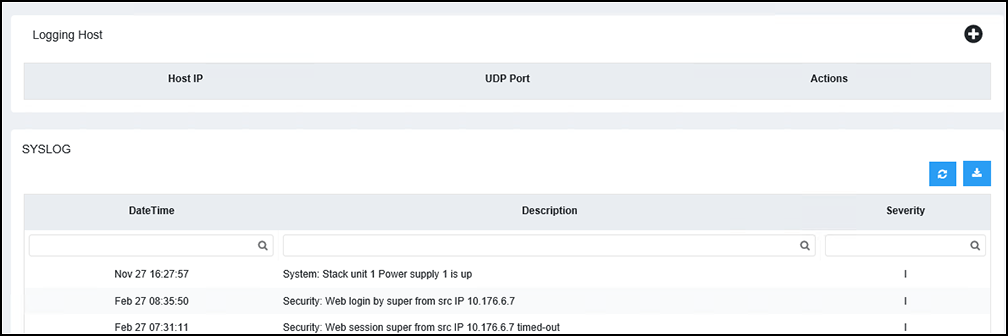
- In the Logging Host
pane, click the
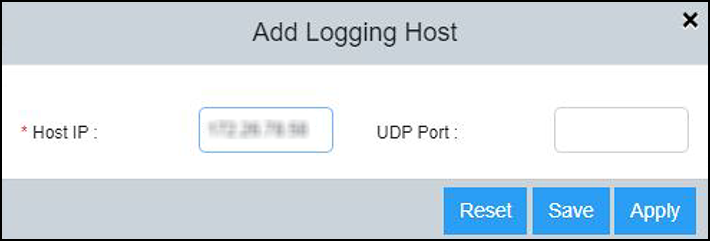
 icon to display the Add Logging Host dialog box.
- Complete the following fields:
- Click Apply to add the
logging host. The SYSLOG pane displays the log details described in the following table.
- Click the
 icon to refresh the data in the SYSLOG table. At any time, you can use
the Search fields (available in each column) to find and display only the table
entries matching the specified search criteria. You can also reorder the table
content by date/time, description, or severity, by clicking the associated
column header.
icon to refresh the data in the SYSLOG table. At any time, you can use
the Search fields (available in each column) to find and display only the table
entries matching the specified search criteria. You can also reorder the table
content by date/time, description, or severity, by clicking the associated
column header. - Click the
 icon to download the logs to the local machine.
 icon to delete an existing server.