Getting to Know the Dashboard
The
Dashboard, which is the first page that appears after you log in to the
RUCKUS IoT Controller, offers an overall picture and status of the IoT infrastructure. The
Dashboard shows the total number of IoT devices and IoT APs, the top IoT APs by device count,
and the devices and APs by protocol.
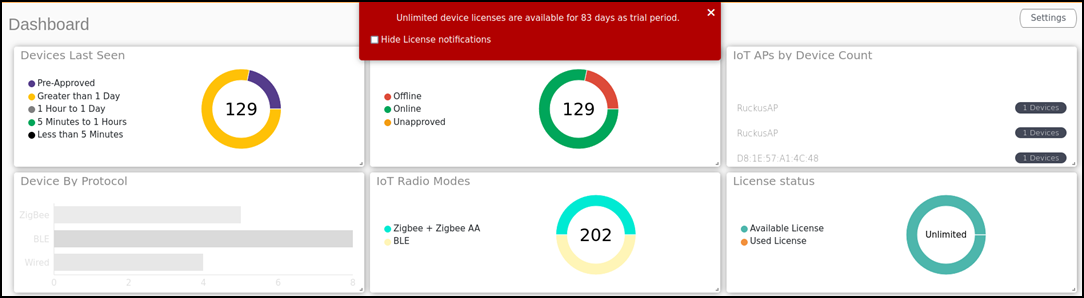
Dashboard Elements
To set up the Dashboard, click the Settings button. The Dashboard Settings menu is displayed.
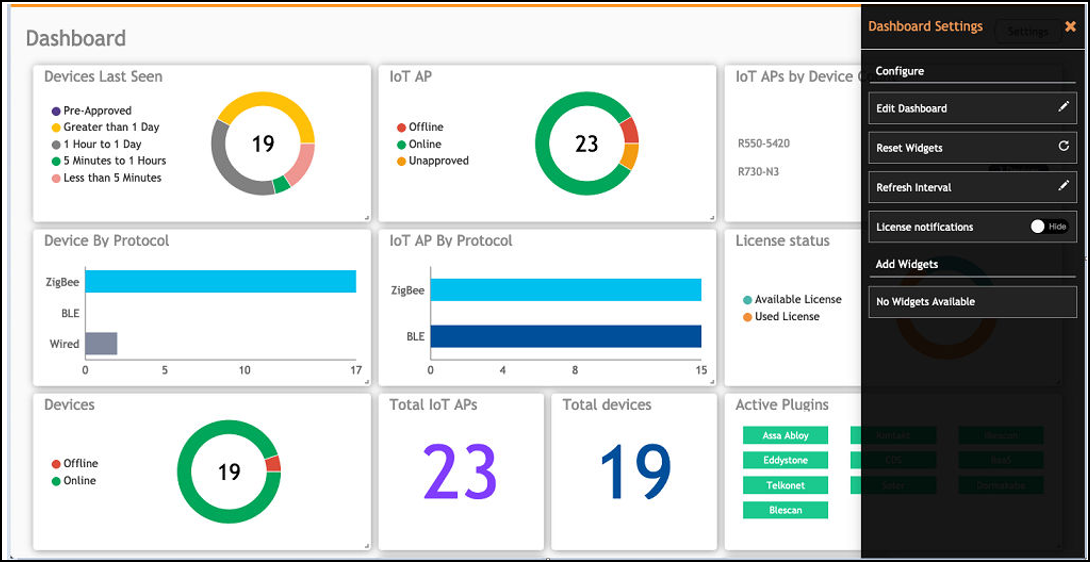
You can perform the following actions to configure the Dashboard.
- To edit the
Dashboard, click
Edit Dashboard and either move the position of the tile using the
 icon or delete the tile using the
 icon.
icon.
- To reset the widgets, click Reset Widgets to retrieve the widgets on the Dashboard.
- To reset the widget display time, click
Refresh Interval to change the display time of the widgets on the
Dashboard.
Note: The default interval is 30 seconds.
The options under Add Widgets allow you to add widgets to the Dashboard. Click + for Devices, Active Plugins, Total devices, License Status, Total Beacons, Total IoT APs, and Total LNS Hubs to add widgets to the Dashboard.