Viewing Data Plane Events and Alarms
The Event and Alarm tabs on the Cluster page
display system-generated records and alarm conditions for the selected Data Plane,
enabling
review and lifecycle management of Data Plane states and issues.
- In the controller web UI, select .
- Select the desired Data Plane from the table.
- Do one of the following:
-
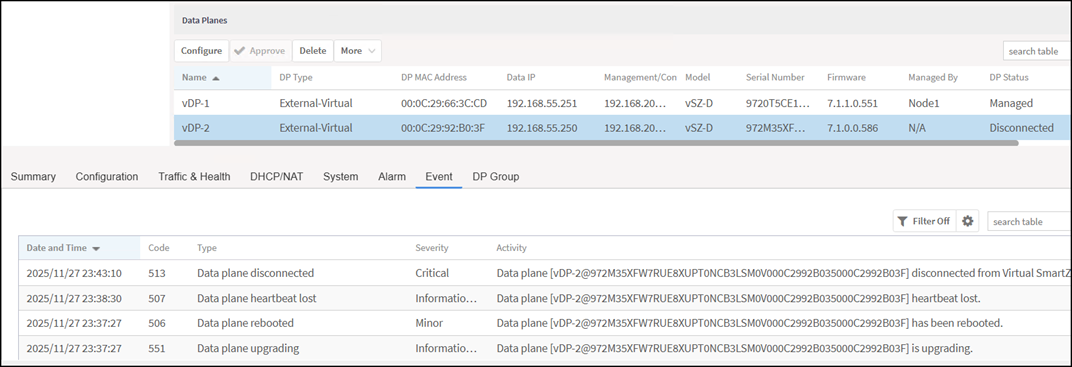
Click Event to view event records. An event record includes columns such as Date and Time, Code, Type, Severity, and Activity.
-
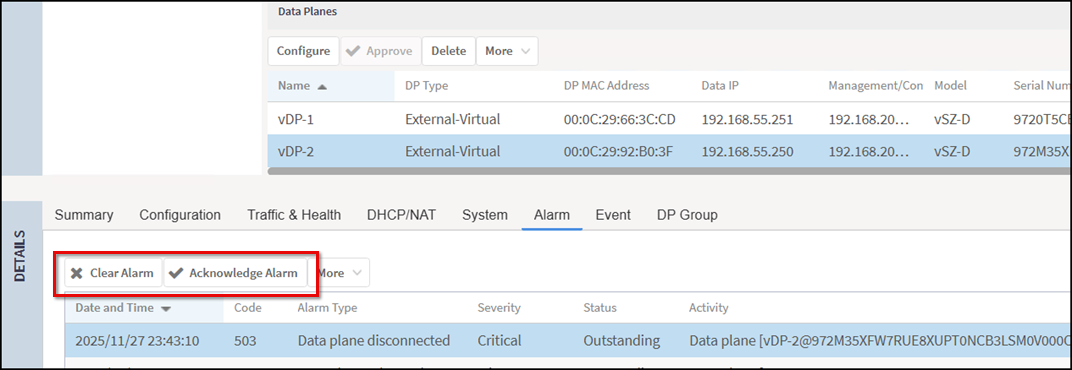
Click Alarm to view alarms. An alarm record includes columns such as Date and Time, Code, Alarm Type, Severity, Status, and Activity, among others. The toolbar includes Clear Alarm, Acknowledge Alarm, and More.
-
- Clear or acknowledge selected
alarms by doing one of the following:
- Acknowledge an alarm by selecting one or more alarms and clicking Acknowledge Alarm. In the confirmation dialog box, click Yes to proceed.
- Clear an alarm by
selecting one or more alarms and clicking Clear Alarm. In the
Clear Alarm dialog
box, type comments in the text box (empty space is not allowed) and click Apply to confirm or
Cancel to abort.
The alarm is cleared and the status changes to cleared.