Viewing AP Tunnel Statistics

The web UI displays the traffic statistics for all tunnels of the same type in a table and a corresponding line chart. The table shows detailed numerical data for transmitted, received, dropped, and error data calculated by packets and bytes. The line chart provides a visual representation of the same data. The two representations are synchronized and controlled by the search criteria.
Note: For performance reasons, the total counters per DP or AP for each bin may be pre-calculated.

Complete the following steps to view the tunnel statistics for the different tunnel types:

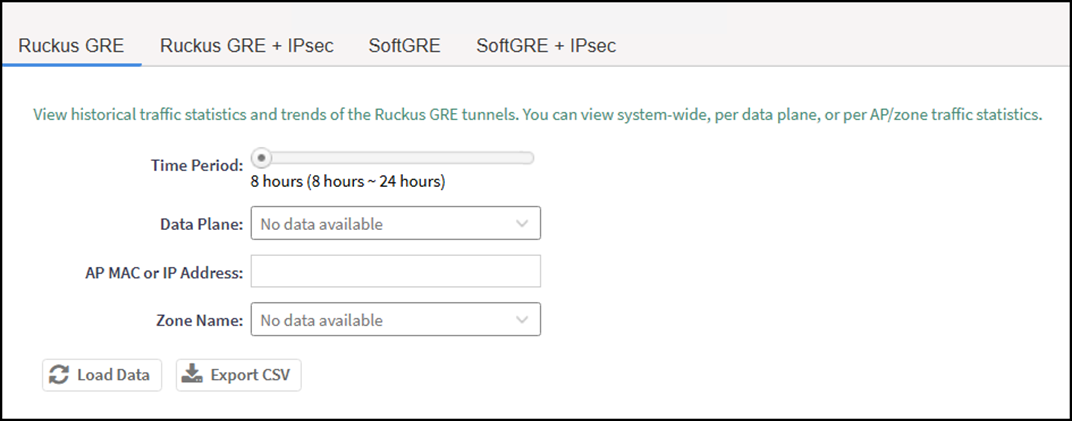
  1. In the controller web UI, select Monitor > Report > Ruckus AP Tunnel Stats.

    The Ruckus GRE tab appears by default.

    Reviewing AP Tunnel Statistics

  2. Select the tunnel type of your interest by clicking the corresponding tab. Choose one of the following:
    • Ruckus GRE
    • Ruckus GRE + IPsec
    • SoftGRE
    • SoftGRE + IPsec
  3. Update the report parameters as explained in Tunnel Report Parameters.

    Tunnel Report Parameters

    Field Description Your Action
    Time Period Indicate the time period for which you want to view the report Move the slider to set the duration
    Data Plane Indicates the Data Plane (available when Ruckus GRE or Ruckus GRE + IPsec option is selected) Select a Data Plane from the drop-down menu
    Gateway Address Indicates the IP address of the third-party gateway terminating the AP tunnel (available when SoftGRE or SoftGRE + IPsec option is selected) Enter the gateway's IP address
    AP MAC or IP Address (Optional) Indicates the MAC of the Access Point or IP Address Enter the AP MAC or IP address to display
    Zone Name Specifies the Zone for which you want to view the report Select the Zone from the drop-down menu
  4. Click one of the following:
    • Load Data: To view the report in the workspace.
    • Export CSV: To open or save the report in CSV file format.

    According to your choice, the data is loaded in the web UI (displaying both a line chart and a table with the tunnel statistics measured in bytes and packets per second) or exported to a CSV file (displaying only the tunnel statistics measured in bytes and packets per second).
AP Tunnel Report Attributes explains the content of the report based on the statistics received for RUCKUS GRE. Each entry contains the 15-minute cumulative data.

AP Tunnel Report Attributes

Attribute Description
Time Date and time (Bin ID), which is stamped at a 15-minute interval. For example, 10:00, 10:15
TX Bytes Indicates the number of bytes sent from the AP
RX Bytes Indicates the number of bytes received by the AP
TX Packets Indicates the number of packets sent from the AP
RX Packets Indicates the number of packets received by the AP
Dropped Packets (Only present for RuckusGRE and RuckusGRE + IPsec tunnel type) Indicates the number of packets dropped
TX Dropped Packets (Only present for SoftGRE and SoftGRE + IPsec tunnel type) Indicates the number of dropped packets transmitted
RX Dropped Packets (Only present for SoftGRE and SoftGRE + IPsec tunnel type) Indicates the number of dropped packets received
TX Error Packets (Only present for SoftGRE tunnel type) Indicates the number of error packets transmitted
RX Error Packets (Only present for SoftGRE tunnel type) Indicates the number of error packets received