Navigating the RUCKUS Remote Management Services for Unleashed Site Admin Portal

The Dashboard is the first page displayed after you log in to the Remote Management Services Site Admin portal. It provides a snapshot of your Unleashed networks and managed devices.
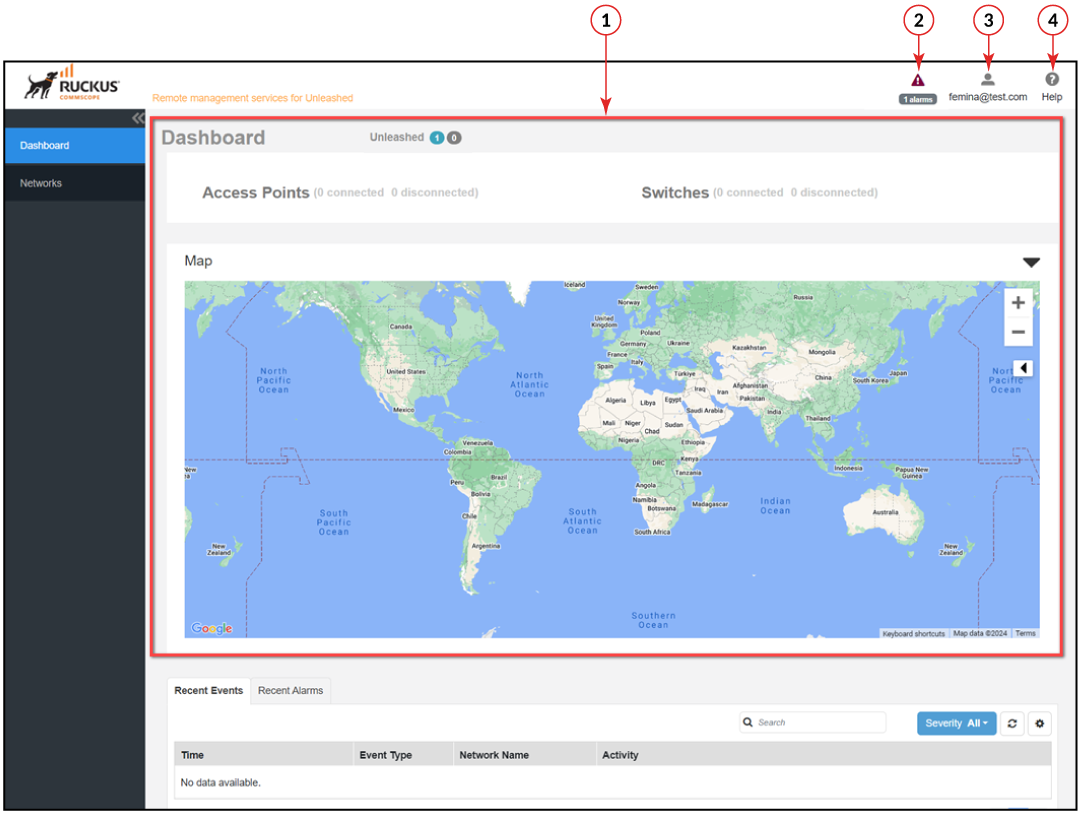
Site Admin User Interface - Dashboard

User Interface Elements

Number Network Element Description
1 Dashboard The content area of the RUCKUS Remote Management Services for Unleashed Site Admin portal Dashboard displays the following information:
  • Unleashed: Displays the number of connected and disconnected Unleashed networks.
  • Access Points: Displays the number of APs that are registered with Unleashed controllers (which, in turn, are being managed by Remote Management Services for Unleashed).
  • Switches: Displays the number of connected and disconnected Unleashed-managed switches.
  • Map: A map which displays the network information across the globe.
2 Alarms

Displays the number of alarms that have been generated on your networks and you can find the detailed information on the Alarms tab.

  • Time: Displays the alarm time stamp.
  • Severity: Displays the severity of the alarm such as Warning, Minor, Major, and Critical.
  • Device Name: Name of the device reporting the alarm. Click this link to go to the devices reporting the specific alarm.
  • Alarm Type: Displays the type of alarm such as AP traffic, number of channel changes, and so on.
  • Activity: Description of the issue that triggered the alarm.

3 Account Displays the email ID of the Site Admin. When clicked, a menu displays the following options:
  • Change Password: Opens the Update Password page.
  • Log Out: Logs the user out from the RUCKUS Remote Management Services for Unleashed Site Admin portal.
4 Help Opens the most current version of the RUCKUS Remote Management Services for Unleashed documentation.