Generation of Alarm and Event
The following are the steps of how alarm and event are generated.
- Alarm
-
An alarm is a persistent indication of a fault that clears only when the triggering condition had been resolved.
-
An alarm can be filtered in the controller web interface based on:
-
Alarm Category - Alarm classifications
-
Alarm Source: Source of the alarm
-
Alarm Status: Could either be outstanding or cleared
-
Acknowledge Time: The time when the alarm is acknowledged
-
Date and Time - Date and time when the alarm is acknowledged
-
Severity: Severity is classified as critical, major or minor
-
Status - Could either be cleared or outstanding
-
Type - Alarm type
-
-
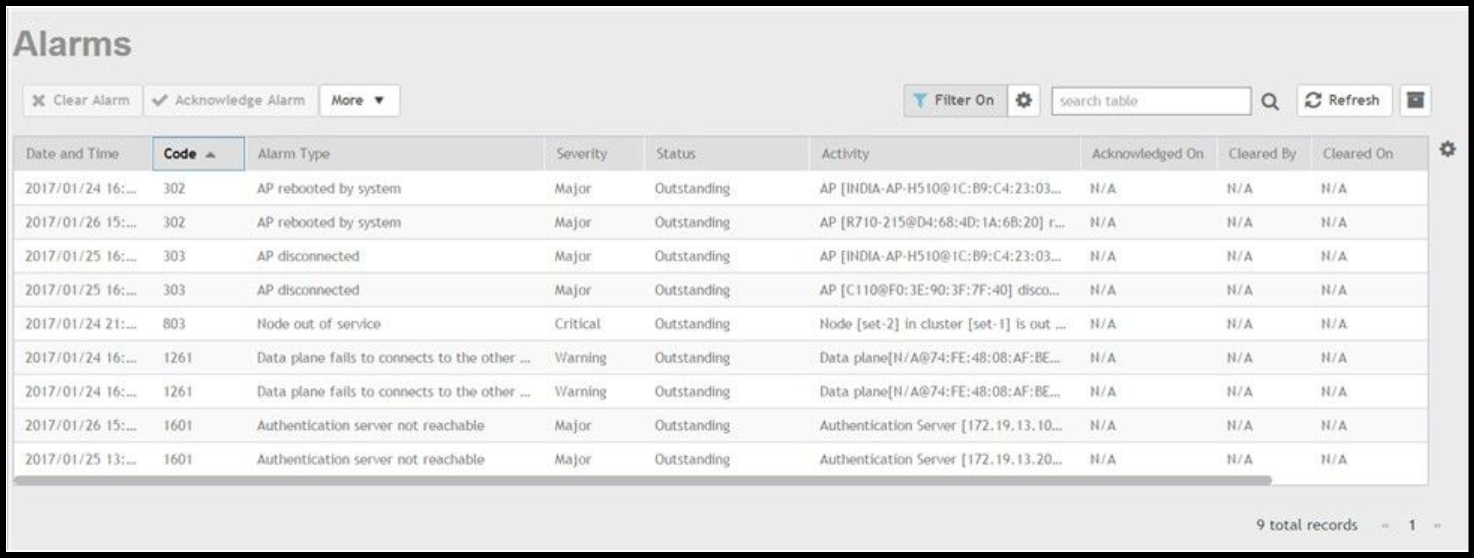
To view the below alarm information in the controller web interface navigate to Events & Alarms > Alarms
-
On an alarm generation, the controller web interface provides the following information as seen in the figure below.
-
Alarm console, which displays the cleared and outstanding alarms visible to the user who is currently logged on.
-
Alarm summary, which lists various information such as outstanding alarm counts, unacknowledged alarm counts, etc.
-
You may clear an alarm or a set of alarms to let other administrators know that you have already resolved the issue. When you select a group of alarms, the Clear Alarm button is activated. Click this button. A text box appears where you can enter comments or notes about the resolved issue. Click Apply when done. To view the cleared alarms, select the cleared option.
- You may acknowledge an alarm or a set of alarms to let other administrators know that you have acknowledged it. When you select an alarm or group of alarms, the Acknowledge Alarm button is activated. Click this button. A text box appears where you need to confirm the acknowledgment. Click Yes when done. The Acknowledged on column in the Alarms table gets updated.
Filtering features based on the alarm attributes.
The Filter button is deactivated by default. Click this button if you want to turn on the filter. Click the gear icon to set the filter. A text box appears where you can enter the severity, status and start and end date and time. Click OK when done.- You may also export the data as a CSV file.
-
-
Event - On an event generation the following:
The controller collects, receives, and maintains the raw events from the managed entities (control plane, data plane, access points, etc.). These raw events are kept in the database, and are automatically purged.
The controller allows users to enable/disable certain event types from the managed entities.
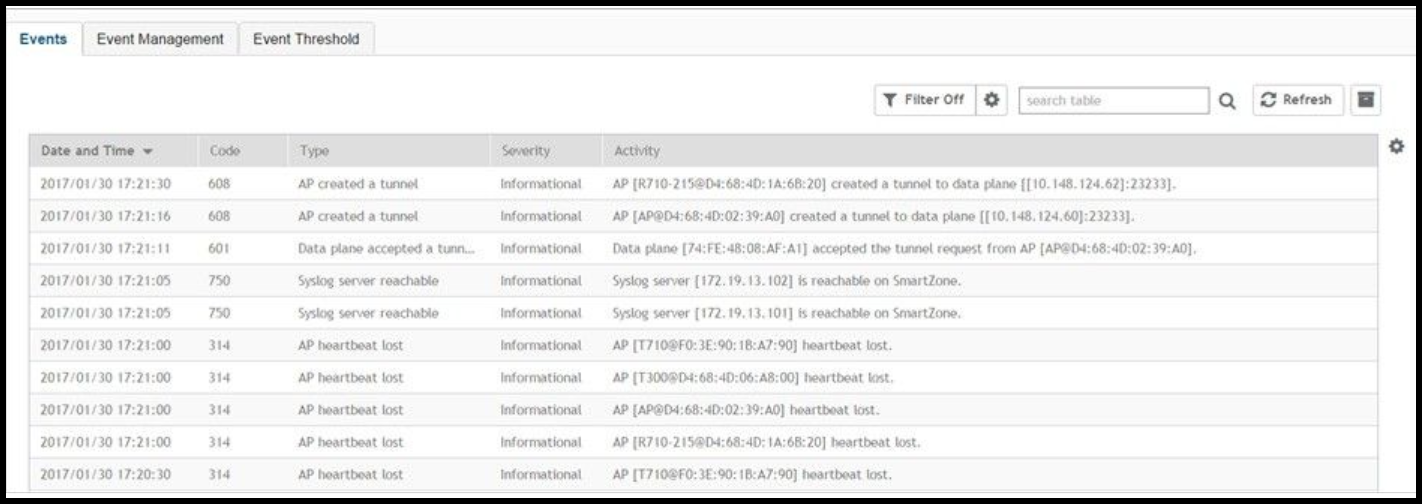
Events - The web interface provides event log window as seen in the figure below, for users to visualize and analyze the events. To view the event information in the controller web interface navigate to Events & Alarms > Events.
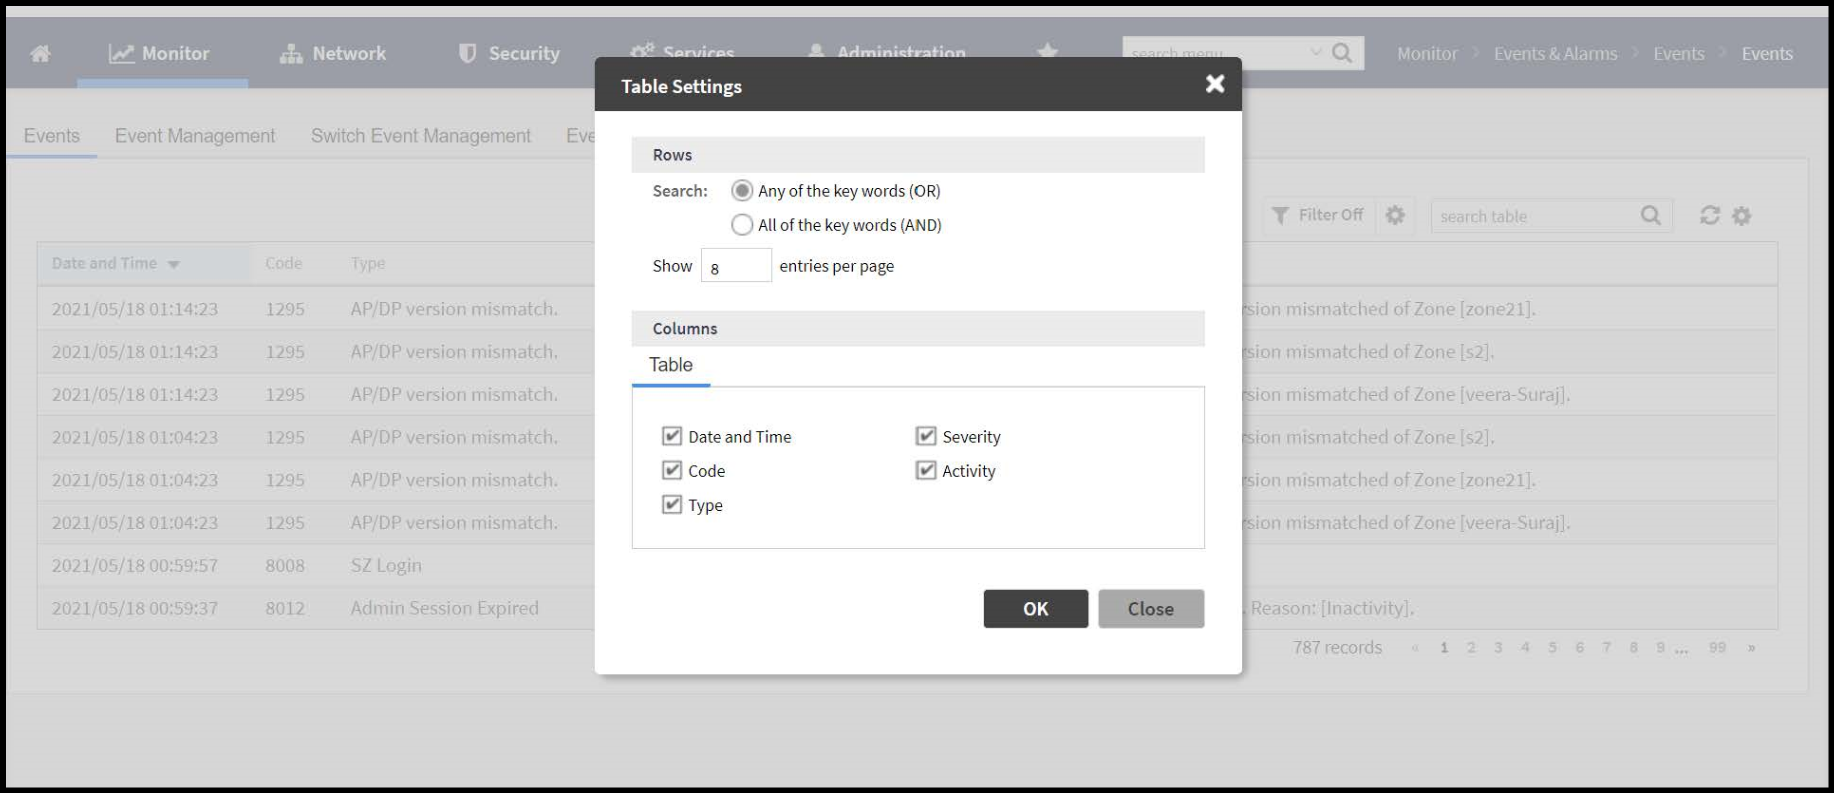
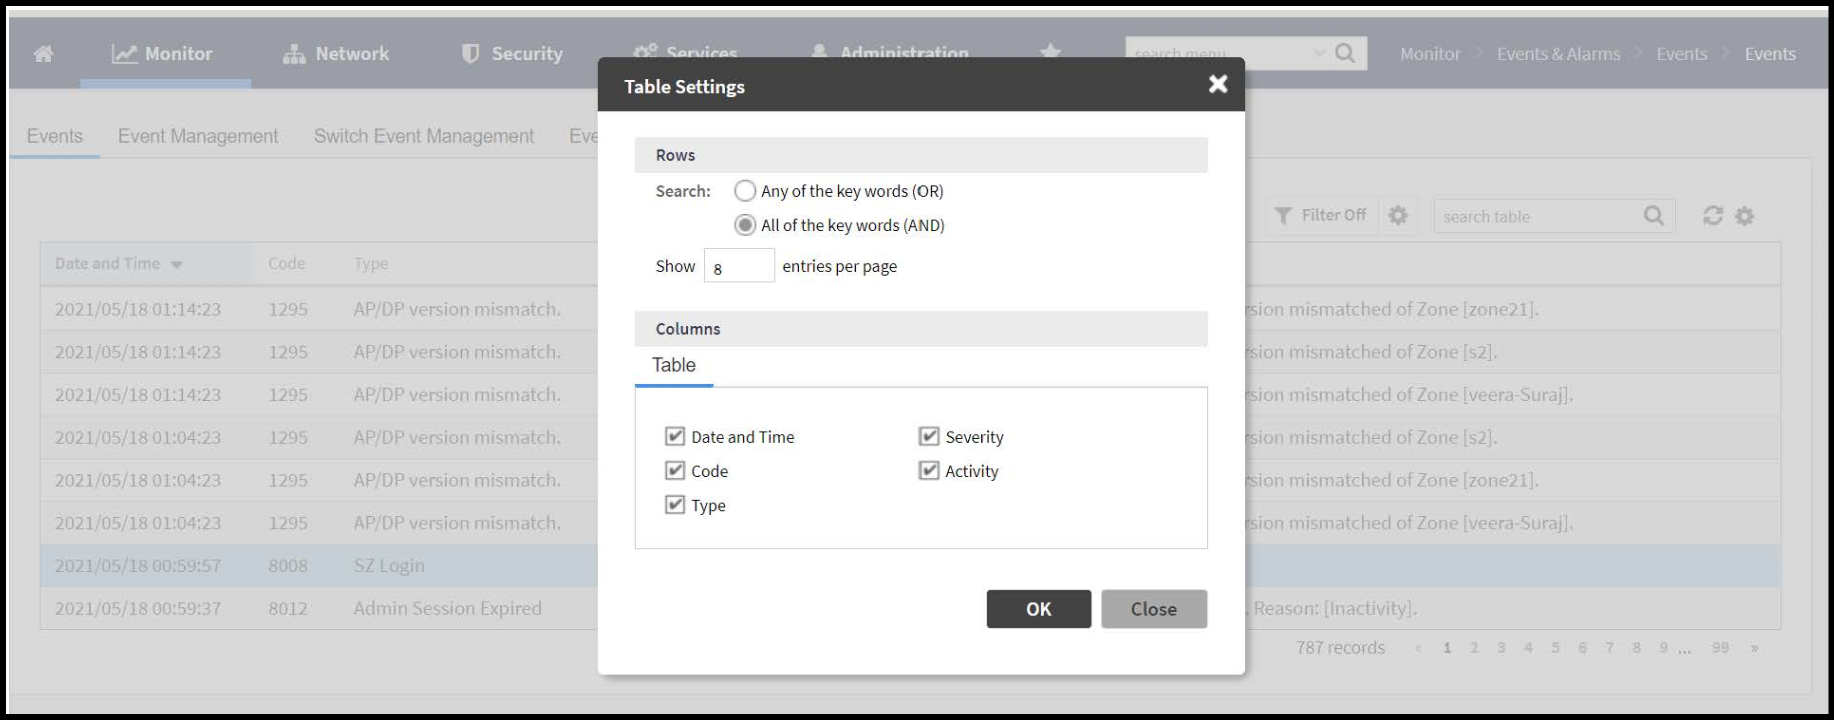
Events can be searched with "OR" or "AND" options as displayed in the below images.
Date and Time: Displays the date and time when the event occurred.
Code: Displays the event code.
Type: Displays the type of event that occurred (for example, AP configuration updated).
Severity: Displays the severity level assigned to the events such as Critical, Debug, Informational, Warning, Major etc.
Activity: Displays additional details about the event, including (if available) the specific access point, control plane, or data plane that triggered.
Event Management lists the disabled events that are filtered at the source whenever possible to minimize resources for processing events. The SMTP server is disabled by default. You must enable and configure the SMTP server so notification emails can be delivered successfully.
Threshold Events are triggered at the source whenever possible.
Users are able to perform various operations on the events, such as filtration, aggregation and counting. The Filter button is deactivated by default. Click this button if you want to turn on the filter. Click on the gear icon to set the filter. A text box appears where you can enter the severity, status and start and end date and time. Click OK when done.
The controller gives you the option of exporting the data as a CSV file.