Viewing Beacons
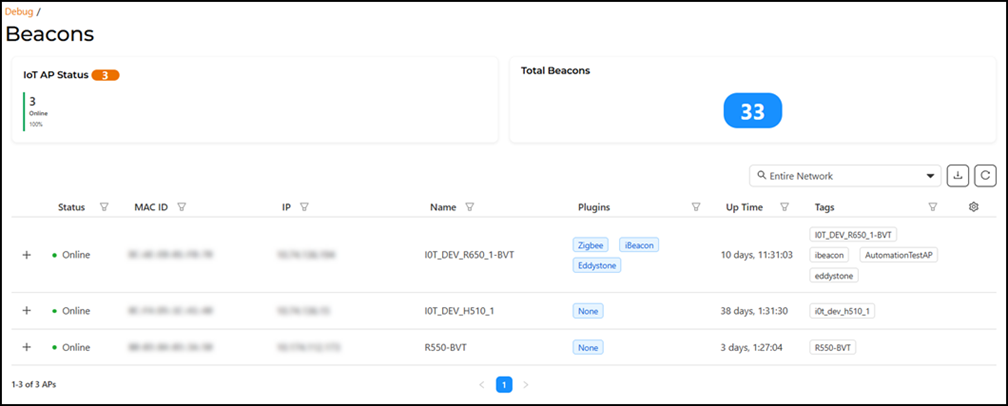
The Beacons page provides an overview of all the beacons detected by the chosen AP, allowing you to monitor and manage the devices connected through that specific AP.
Attention: To view the Beacon info column ensure the Log Level is set to DEBUG.
For more information on Log Level settings, refer to the topic Configuring the General Settings.
At the top of the page, you will find quick overview tiles:
- IoT AP Status: Displays the total number of IoT APs and their operational status (for example, Online or Offline).
- Total Beacons: Shows the total count of detected beacons across all connected APs.
The main panel displays all the IoT APs. The table includes columns such as Status, MAC ID, IP, Name, Plugins, and so on.
- From the main menu, select .
- (Optional) Customize the table display.
- Modify the order of rows displayed. Click on any column header to reorder the table rows in ascending or descending order based on that specific column’s values.
- Modify the number of rows displayed per page. The table defaults to
displaying 10 rows of data. Below the table, you will find page display
options:
- The entries-per-page drop-down allows you to control how many rows of data are displayed per page (options include 10, 20, 50, and 100).
- Arrow keys help you navigate between pages of data in the table
when the table exceeds the entries-per-page setting.
Note: If the arrows are greyed out, it means you are already on the first or last page and cannot move further in that direction.
-
Click the
 icon to choose which columns to display
in the Beacons table. By checking or unchecking boxes, you can
tailor the view based on what information is relevant to you.
icon to choose which columns to display
in the Beacons table. By checking or unchecking boxes, you can
tailor the view based on what information is relevant to you.
- (Optional) Click the
 icon in any column header. A textbox appears. Enter a filter value (for example,
filter by a specific Name, IP, or Status, and so
on). The table will update to display only the APs that match your filter
criteria.
icon in any column header. A textbox appears. Enter a filter value (for example,
filter by a specific Name, IP, or Status, and so
on). The table will update to display only the APs that match your filter
criteria. - (Optional) Filter the table
content based on the level in the network hierarchy (from Entire
Network down to one specific AP).
The Network Hierarchy filter, displayed above the Radios table, allows you to control or modify the scope of data displayed in the table. By default, the view is set to Entire Network, which consists of the full hierarchy containing all clusters, domains, groups, and APs. Use the drop-down list to select the specific portion of the network for which you want to display data, then click Apply.
The page refreshes displaying only the APs associated with the matching the filter criteria.
- (Optional) Click the
 icon to download the details of the listed IoT APs into a CSV file.
 - (Optional) Click the
 icon to reload the data.
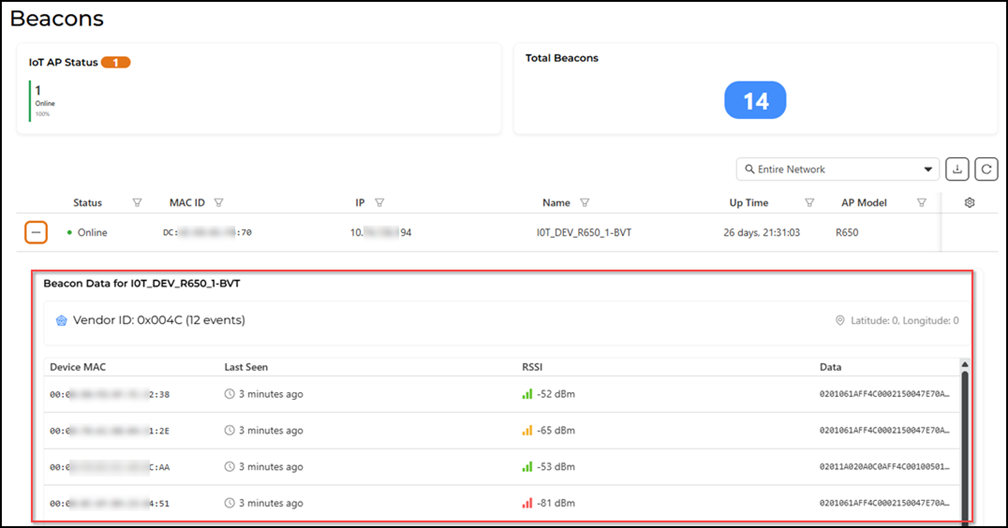
 - Click the
 icon to view the beacon data linked to the AP that is currently monitoring
beacon signals.The Beacon Data table for a specific AP provides detailed information about nearby beacon devices that the AP has detected.
icon to view the beacon data linked to the AP that is currently monitoring
beacon signals.The Beacon Data table for a specific AP provides detailed information about nearby beacon devices that the AP has detected.- Device MAC: The unique MAC address of each detected device.
- Last Seen: The time since the device was last detected.
- RSSI: Received Signal Strength Indicator, which indicates the strength of the received signal from the device. Values are typically negative, with closer to 0 being a stronger signal.
- Data: Additional information or identifiers associated with the device, such as its unique identification data.