The web interface displays the table and its corresponding graph chart. The two representations
are synchronized and controlled by the search criteria. For performance reasons, the
total counters per DP or per AP for each bin may be pre-calculated.
To view the RUCKUS GRE Tunnel Statistics:
- Select . The Ruckus GRE tab appears by default.
- Update the parameters as
explained in RUCKUS GRE Report
Parameters.
- Click:
- Load Data— To
view the report in the workspace.
- Export CSV—To
open or save the report in CSV file format.
RUCKUS GRE Profile
page
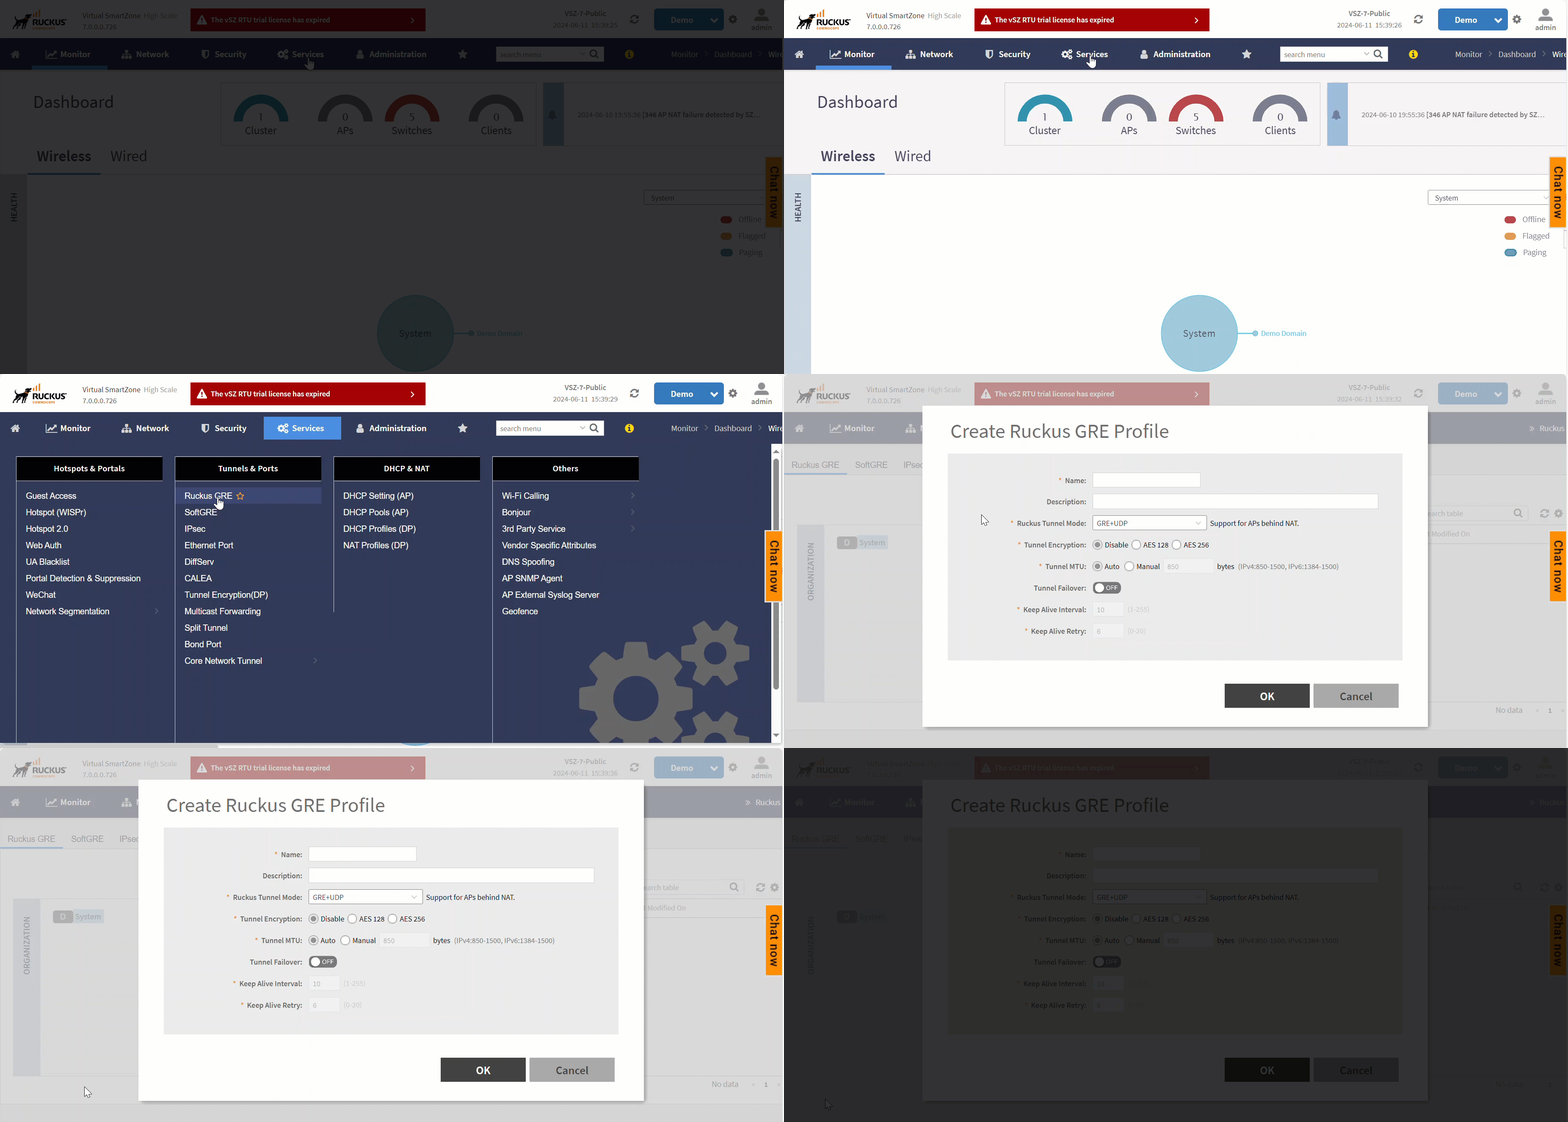
RUCKUS GRE Report
Parameters
| Field |
Description |
Your Action |
| Time
Period |
Indicate the time period for which you want
to view the report. |
Move the slider to set the duration. |
| Data
Plane |
Indicates the Data Plane. |
Select the Data Plane. |
| AP MAC or
IP Address |
Indicates the MAC of the Access Point or IP
Address. |
Enter the AP MAC or IP address. |
| Zone
Name |
Specifies the zone for which you want to view
the report. |
Enter the zone name or select the zone from
the list. |
RUCKUS GRE report
attributes contains the report based on the statistics for RUCKUS
GRE. Each entry contains the 15 minutes cumulative data.
RUCKUS GRE report
attributes
| Attribute |
Type |
Description |
| Time |
Long |
Bin ID, which is stamped at a 15 minute interval.
For example, 10:00, 10:15. |
| TXBytes |
Long |
Indicates the number of bytes sent. |
| RXBytes |
Long |
Indicates the number of bytes received. |
| TXPkts |
Long |
Indicates the number of packets sent. |
| RXPkts |
Long |
Indicates the number of packets received. |
| Dropped Packets |
Long |
Indicates the number of packets dropped. |