Viewing Group Details
When you select a group, you can view details about the APs associated with the group,
alarms and events. You can also view the switches in a switch group and their associated
ports, alarms, events, traffic trends and LLDP neighbors.
UMM 2.2
- After you to log in to the Web interface, select
Devices from the menu in the left.
The Devices page appears listing all the devices managed by the software.
- From View Mode, select Group to view the groups of devices.
- From the tree hierarchy, select a group that you created.
The following information is displayed for APs:
- Access Points: displays
information about the APs in the group such as the device name, model,
IP address, state, software version etc. Additionally, you can also view
the following:
- General: displays general information about the AP such as controller name, IP address, location and so on.
- Trend: displays graphical trends pertaining to the associated clients, traffic and state of the AP.
- Mesh: displays details about the AP mesh type, up link and down link.
- WLANs: displays information about the WLANs associated with the AP such as ESSID, BSSID and radio.
- Radio: display details about the radio information of the AP.
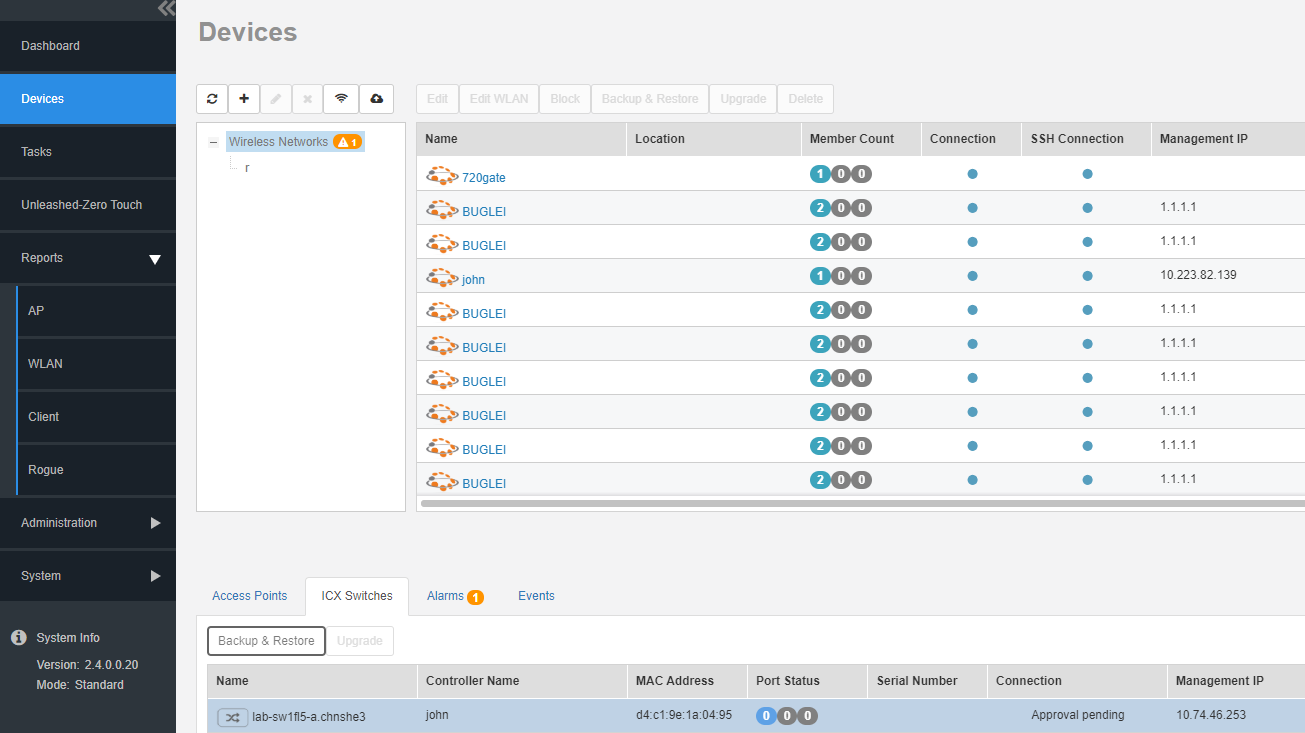
- ICX Switches: displays the
details of the switches.
UMM 2.4 (changed the group details fig also)The backup or restore and the upgrade options are supported in the ICX switches tab.
- Alarms: displays alarms that are Active and those that were generated earlier (under the History tab). You can select an alarm from this list and click Acknowledge to accept the alarm. A success message is displayed when it is accepted.
- Events: displays the events generated.
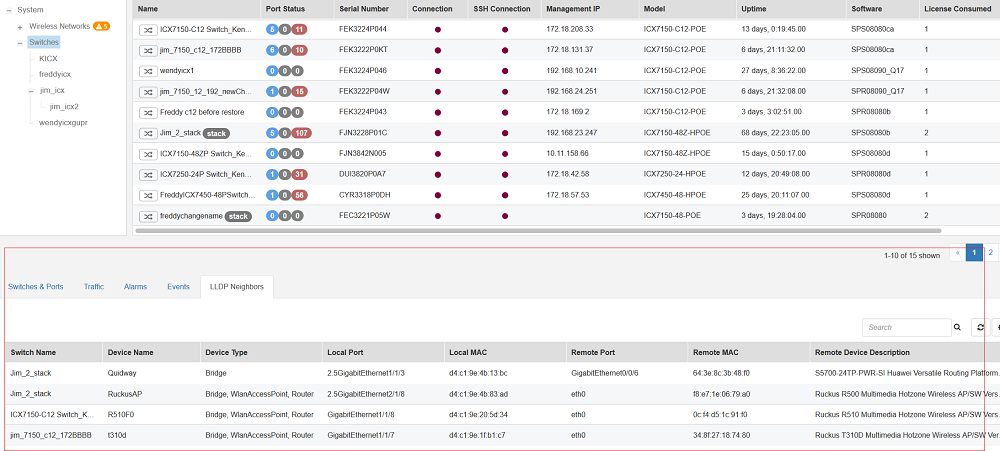
The following information is displayed for switch groups and individual switches:- Switches & Ports: displays information about the switches such as the top switches
by model, firmware, ports summary details, and ports details such as the following:
- Switch Name: displays the name of the switch
- Serial Number: displays the serial number of the switch
- Port Name: displays the port name
- Port Number: displays the port number
- Status: displays whether the port is operationally Up or Down
- Admin Status: displays whether the port has been set to Up or Down by the network administrator
- Speed: displays the speed of the port
- PoE Usage (used/total watts): displays the PoE power usage compared to the allocated power
- VLANs: displays the VLAN(s) to which the port is connected
- Bandwidth IN (%): displays the bandwidth utilization for incoming traffic
- Bandwidth OUT (%): displays the bandwidth utilization of the port for outgoing traffic
- LAG Name: displays the name of the Link Aggregation Group (LAG)
- Optics: displays the type of optic
- Neighbor Name: When LLDP is enabled, the name of the neighboring device, such as an AP or another switch or router
- Ports (tab appears only for individual switches): displays the
Ports Summary page provides information on the ports for the selected switch, including the total
number of ports connected to the switch or stack, the number of ports active at various
speeds, operational status of the ports (Up or Down), warnings associated with ports
when alarms or events are triggered, and the number of ports managed by an administrator.
The Ports View page provides information on the state of all ports in each switch module, for example port Up, Down, or Administratively Down.
- Health (tab appears only for individual switches): displays the switch health for
the duration selected from the drop-down menu.
Note: For switch stack, the health of the master unit is displayed.
The following information is displayed based on the duration selected:
- CPU (%): The CPU usage of the switch, including the minimum, maximum, average, and current CPU usage trends of the switch.
- Memory (%): The memory usage of the switch, including the minimum, maximum, average, and current memory usage trends of the switch.
- Status: The health status of the power supply, temperature, and the fans for up to four switch modules are displayed. OK indicates the parameter and components are in good health.
- Traffic: provides a graphical representation of the total traffic trend at the switch-level and also shows the top switches based on the traffic handled by the device.
- Alarms: displays alarms that are Active and those that were generated earlier (under the History tab). You can select an alarm from this list and click Acknowledge to accept the alarm. A success message is displayed when it is accepted.
- Events: displays the events generated.
- LLDP Neighbors: Link layer discovery protocol or LLDP is used to discover and identify the clients. You can view information about the LLDP neighbors such as printers, VOIP devices, or other user equipment connected to the switch.
- Access Points: displays
information about the APs in the group such as the device name, model,
IP address, state, software version etc. Additionally, you can also view
the following: