Getting to Know the Dashboard
The Dashboard provides a comprehensive overview of the IoT network, presenting real-time statistics and visual summaries of key metrics such as IoT access points by device count, radio personal area network (PAN) modes, device protocol distribution, and recent device activity.
It allows you to quickly assess network health, identify trends, and monitor connectivity across all IoT devices from a single, centralized interface.
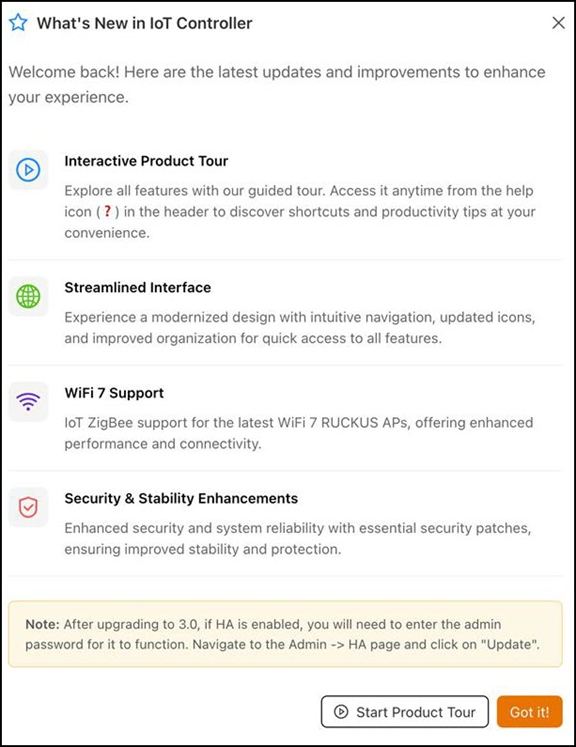
Upon login to the RUCKUS IoT Controller, a What's New in IoT Controller screen pops up. Click Start Product Tour to explore the IoT features or click Got it to close the screen and return to Dashboard.
The header region spans the GUI browser window and remains fixed no matter where you navigate within the GUI. The header displays the controller-specific information and provides access to additional resources and to your user account. The following table describes the header elements:
Global Header Elements
| Component | Description |
|---|---|
| Name | Displays the name of the RUCKUS IoT Controller. |
| Status | Displays the High Availability (HA) status of the RUCKUS IoT Controller. |
| IoT Version | Displays the current version of the RUCKUS IoT Controller. |
| Date and Time | Displays the date and time of the RUCKUS IoT Controller. |
 |
When you hover over the |
| User Icon |
Indicates the logged-in user. When you click the user icon, a menu appears with the following options:
|
The Dashboard, which is the landing page, offers an overall picture and status of the IoT infrastructure. The top portion displays the status of IoT APs, Radios, RUCKUS capacity (RCAP) licenses, and Network Health. The lower portion displays the IoT widgets.
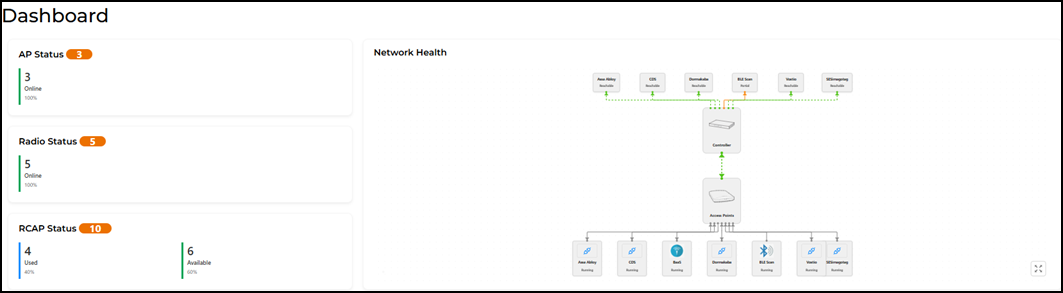
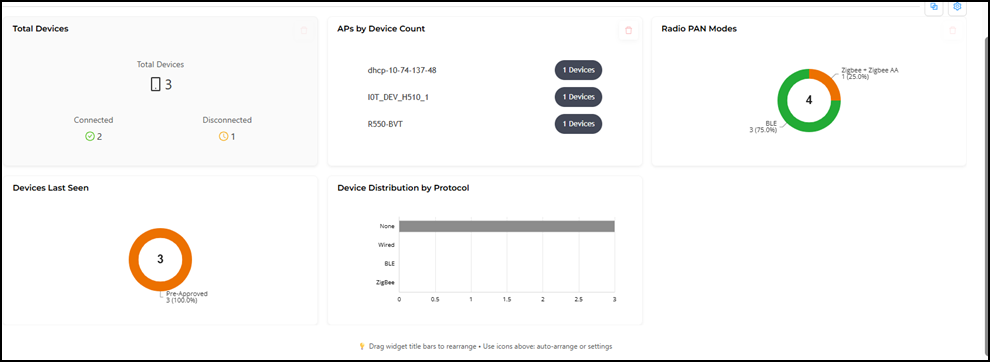
The following table describes the dashboard elements.
Dashboard Elements
The Network Health diagram is designed to help administrators monitor the health, connectivity, and data flow between the controller, access points, and integrated IoT services. It provides a quick visual overview to identify which elements are operational, unreachable, or experiencing issues.
Color-coded lines and icons highlight the communication status:
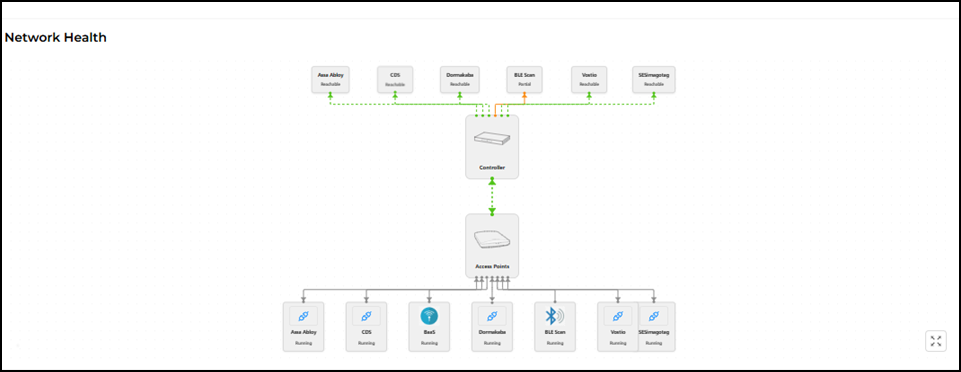
- Green indicates normal connectivity.
- Red highlights unreachable or failed connections.
- Orange indicates a mixed connection status.
Click the  icon to
view the topology map in fullscreen mode while maintaining the hover-over
functionality.
icon to
view the topology map in fullscreen mode while maintaining the hover-over
functionality.
By combining the topology map with hover-over details, Network Health helps you to quickly identify issues, verify connection status, and monitor the overall stability of the RUCKUS IoT Controller infrastructure.
To customize which IoT widgets appear in the
lower portion of the Dashboard, click the  icon. The
Dashboard Settings sidebar is displayed.
icon. The
Dashboard Settings sidebar is displayed.
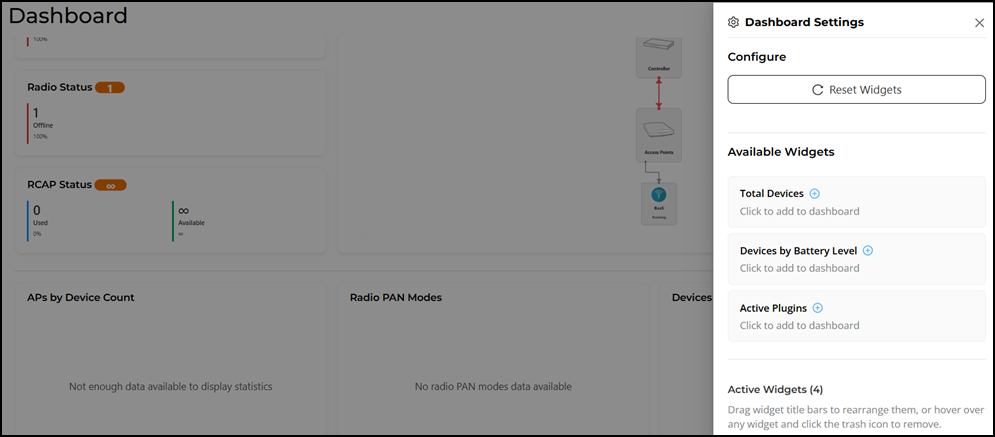
Perform the following actions to configure and add widgets on the Dashboard.
- In the Configure section, click Reset Widgets to restore the default set of widgets.
- In the Available Widgets section, click widgets such as Total devices, Devices by Battery Level and Active Plugins to add them to the Dashboard page.
Perform the following actions to customize the layout of the IoT widgets on the Dashboard.
 icon.
icon. icon.
icon.