Viewing Events
- In the main menu, click
Monitor and hover the mouse on
Events from the Events &
Alarms menu. From the Events drop-down
list select EventsThis displays Events page. The Events page displays the below information.
You can also click the Filter Settings to apply filters and to display events based on time and severity.
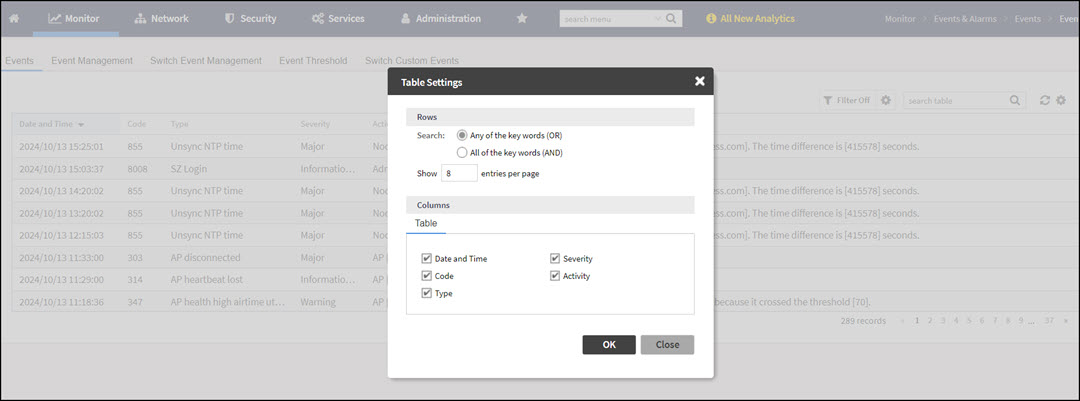
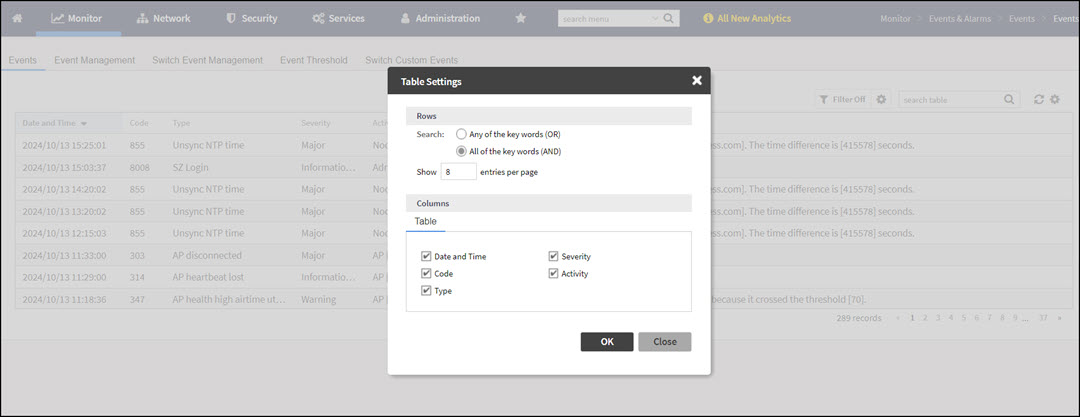
Events can be searched with "OR" or "AND" options as displayed in the below images.
- Date and Time: Displays the date and time when the event occurred
- Code: Displays the event code (see the Alarm and Event Reference Guide for your controller platform more information).
- Type: Displays the type of event that occurred (for example, AP configuration updated).
- Severity: Displays the severity level assigned to the events such as Critical, Debug, Informational, Warning, Major etc.
- Activity: Displays additional details about the event, including (if available) the specific access point, control plane, or data plane that triggered the event.