Troubleshooting through Spectrum Analysis
Interference between wireless devices is seen to
increase dramatically due to the increase in the number of device used, and the availability
of
only three non-interfering channels in 802.11. This reduces the performance of the
wireless
network, therefore, it is important to monitor the spectrum usage in a particular
area and
efficiently allocate the spectrum as needed to wireless devices.
APs which are put in spectrum-mode transmit data to the controller, which in turn displays the data in specturm-mode for analysis.
- In the main menu, click Monitor. Select
Troubleshooting from Troubleshooting &
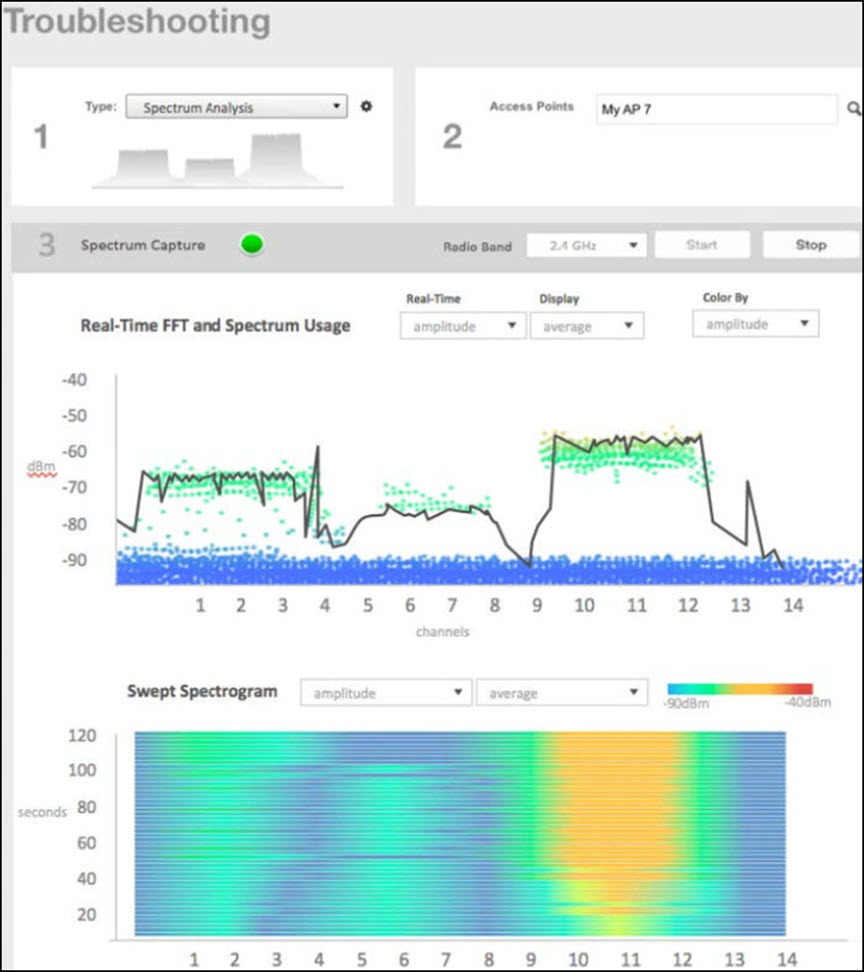
Diagnostics menu.This displays Troubleshooting window as shown in the below example.
- In Type, select Spectrum Analysis from the drop-down menu.
- In AP MAC Address, select the AP that needs to be in the spectrum analysis-mode.
- In Spectrum Capture, select the radio
frequency values (2.4GHz or 5GHz) for the analysis from the Radio option. The 2.4GHz band spans from 2400 - 2480 GHz and 5GHz band spans from 5.15 - 5.875 GHz.
You can select and view the spectrum analysis trends in these graphs:
- Spectrum Usage: This chart uses a color-based view to show collections of data points over time. As more data samples are measured at a specific frequency and amplitude coordinate, the color shown at that coordinate will change. If you choose to view colors by amplitude, the warm colors depict higher amplitude and cool colors lower amplitudes. If you view the colors by density, the warm colors depict a high number of samples at a given coordinate and cool colors show low number of samples at a given coordinate.
- Real-Time FFT : This chart is a second-by-second (2sec) update of measured data across the band. If you view by Amplitude (signal strength), then the chart displays both average and maximum amplitudes of energy measured across the band for that sample period. If you view by Utilization (duty cycle), then the chart displays the percentage (%) of time at which the frequency is utilized at an amplitude above N. The amplitude threshold is configurable but the default is -85dBm.
- Swept Spectrogram: This chart displays a waterfall of color over time, where each horizontal line in the waterfall represents one sample period (e.g. 2 seconds), and the full waterfall display spans 2 minutes of time (60 sample bins of 2sec each). There are two display options for the spectrogram chart:
- After you select the parameters that you want to use to view the graphs, click Start.
- Click Stop to terminate viewing spectrum analysis trends.