Activating the Monitoring Services
The Monitoring Services collect and store
time-series data (metrics) from various targets, enabling you to query, and make analysis
based on this data. The multi-dimensional data model has its own query language (PromQL)
to
communicate. The Monitoring Services assist in monitoring and ensuring the reliablility
of
system and applications.
- From the main menu, click Admin.
- In the left navigation pane,
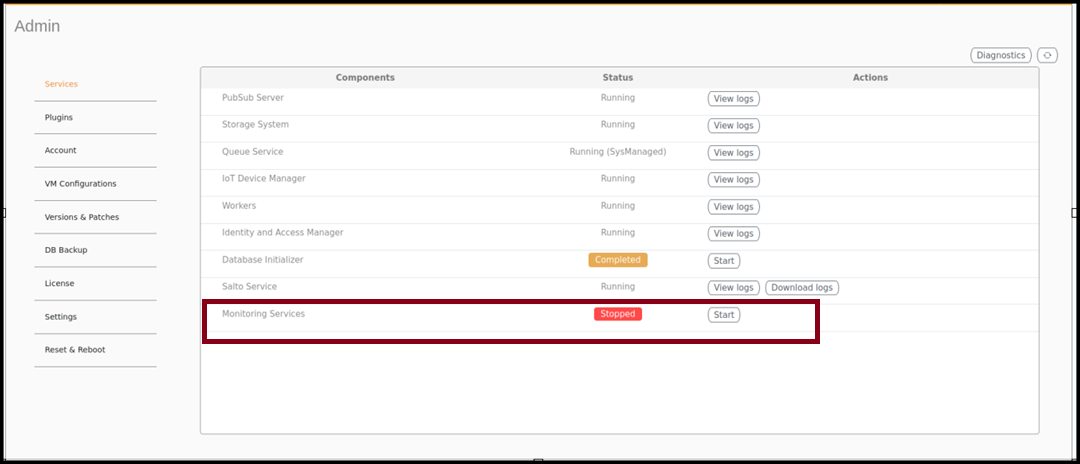
select Services.The currently running services and their details are displayed.
- Select Monitoring Services and click Start.
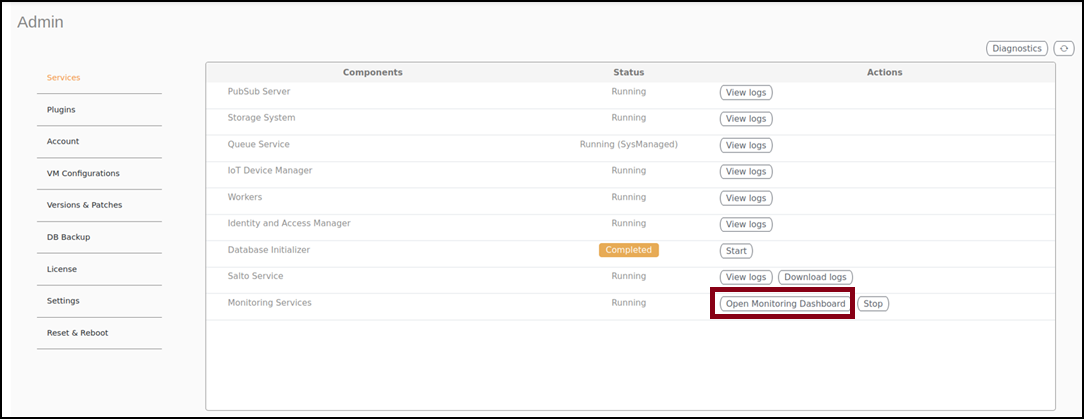
- Click the Open Monitoring Dashboard to open the Prometheus Dashboard page.
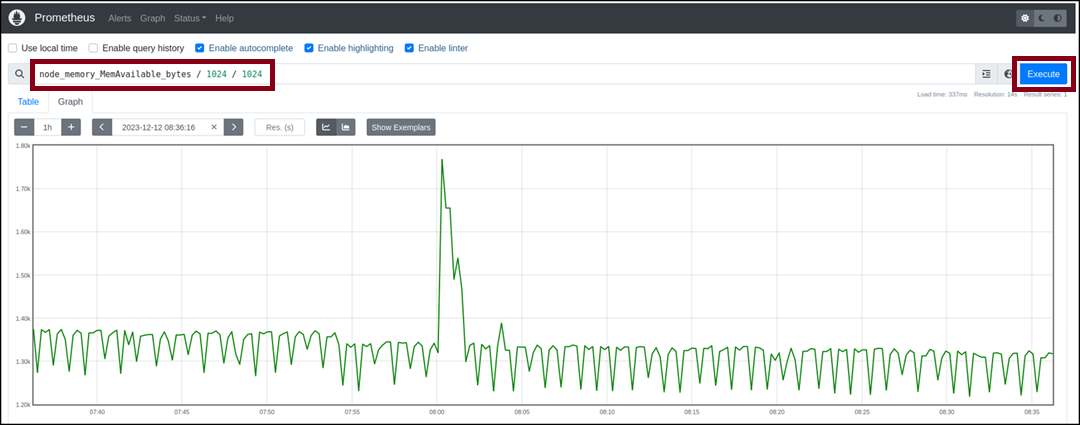
- Enter the Prometheus query in the Search field and click Execute.
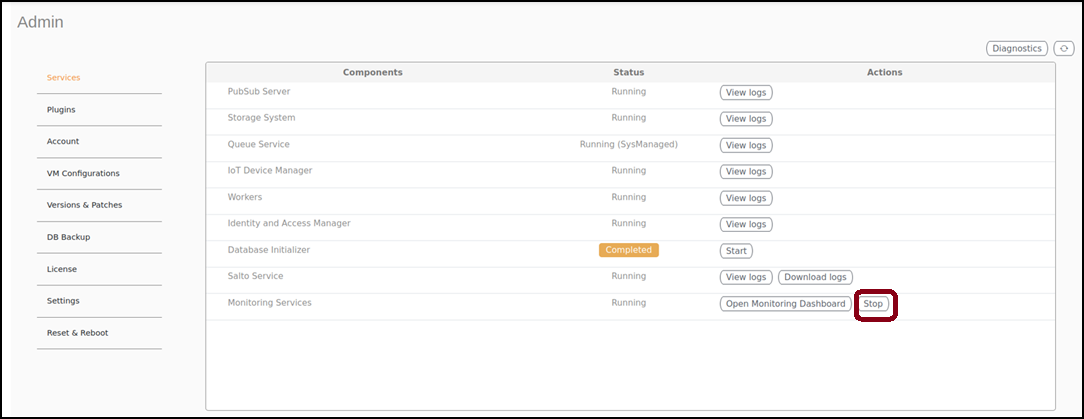
- To de-activate the Monitoring Services, from the main menu, go to and click Stop.