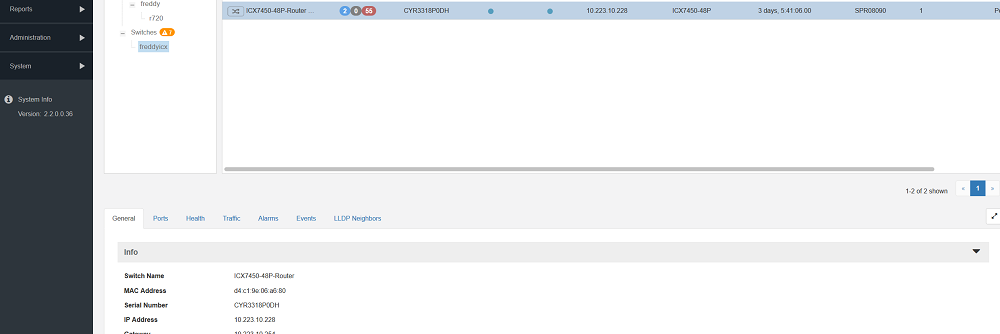
| General |
Displays the following information: - Info: Provides
basic device information including the number of
data bytes and packets transmitted and received by
the device. Click Save Unleashed System Log to save the
unleashed system log.
- Device
View: Provides detailed information
about the clients and APs associated with the
device.
- LAN Ports:
Provides detailed information about the ports open
to the device, the speed of data transfer and
reception, and the number of data packets and
bytes transmitted and received.
|
| Access Points |
Displays a table with
detailed information about the APs associated with the
device, such as the number of authorized clients
associated with the AP, software version, model number,
uptime, IP address, and current status of the AP. The
APs are displayed in a tree structure. In
addition, the following information is displayed:
- General: displays general properties of the
AP
- Trend: displays a graphical representation of
the associated clients, traffic trends and AP
status.
- Mesh: displays the mesh type, uplink and
downlink APs
- WLANs: displays the BSSID and ESSID of
associated WLANs
- Radio: displays the current radio channel
properties that the AP is using
|
| ICX Switches |
Displays a table detailing information about the
ICX switch such as Name, Controller Name, MAC
Address, Port Status, Serial Number, Connection,
Management IP, Model, Last Seen, Uptime, and
Software.
Beginning with UMM 2.4, the
backup or restore and the upgrade options are supported
in the ICX switches tab. |
| Mesh View |
Displays a table that
lists the mesh details of the device, such as the mesh
topology, signal strength, MAC address, IP address,
channel used, and number of authorized clients. |
| Clients |
Displays a table
detailing information about the client, such as the MAC
address of the wireless client, IP address assigned to
the client, radio channel the client uses, signal
strength, VLAN ID assigned to the client, uplink and
downlink traffic, and client connection status. |
| WLANs |
Displays a table that
lists the WLANs configured on the device, including the
WLAN names, ESSIDs, authentication and encryption
methods, and the number of clients associated with each
WLAN, and the Tx/Rx of bytes and packets. |
| Alarms |
Displays a table that
lists information about the type of alarm that was
triggered, the time and date when the alarm was
generated, the severity and activity associated with the
alarm. |
| Events |
Displays a table that
lists information about the type of event that was
triggered, the time, event type, severity and activity
associate with the event. |
| Rogues |
Displays rogue (or unauthorized) APs that pose
problems for a wireless network in terms of airtime
contention, as well as security. Information such as
the rogue AP SSID, type, channel, and so on is
displayed. This tab is only applicable for
ZoneDirector devices and Unleashed networks..
|
| Traffic Analysis |
Displays traffic trends
as graphs. The following trends are available: - Top 10
APs Traffic
- Top 10
APs Client
- Top 10
Clients Traffic
- Client
OS Traffic
- Model
Traffic
- Client
Count versus AP Counts by Model
- AP
Status
- Vendor
versus AP
|
 to refresh the contents of the tables within the tabs. You can also customize the
tables by clicking the Configure table icon
 . You can also use the
Search field to look for specific information within the tables.