Getting to Know the Dashboard
After you log in to Unleashed Multi-Site Manager, the Dashboard is the first page that is displayed. The Dashboard provides a quick summary of what is happening on Unleashed Multi-Site Manager and its managed devices.
The Auto Refresh menu allows you to select the time interval for the page to refresh automatically and display the latest information. The Time Period menu allows you to select the period of time for which data must be displayed in the Dashboard. You have the option to select 12 hours, 24 hours, 7 days, or 3 months. The Group All menu allows you to select the data you want to display on the Dashboard. You can select All or select another group based on the user.
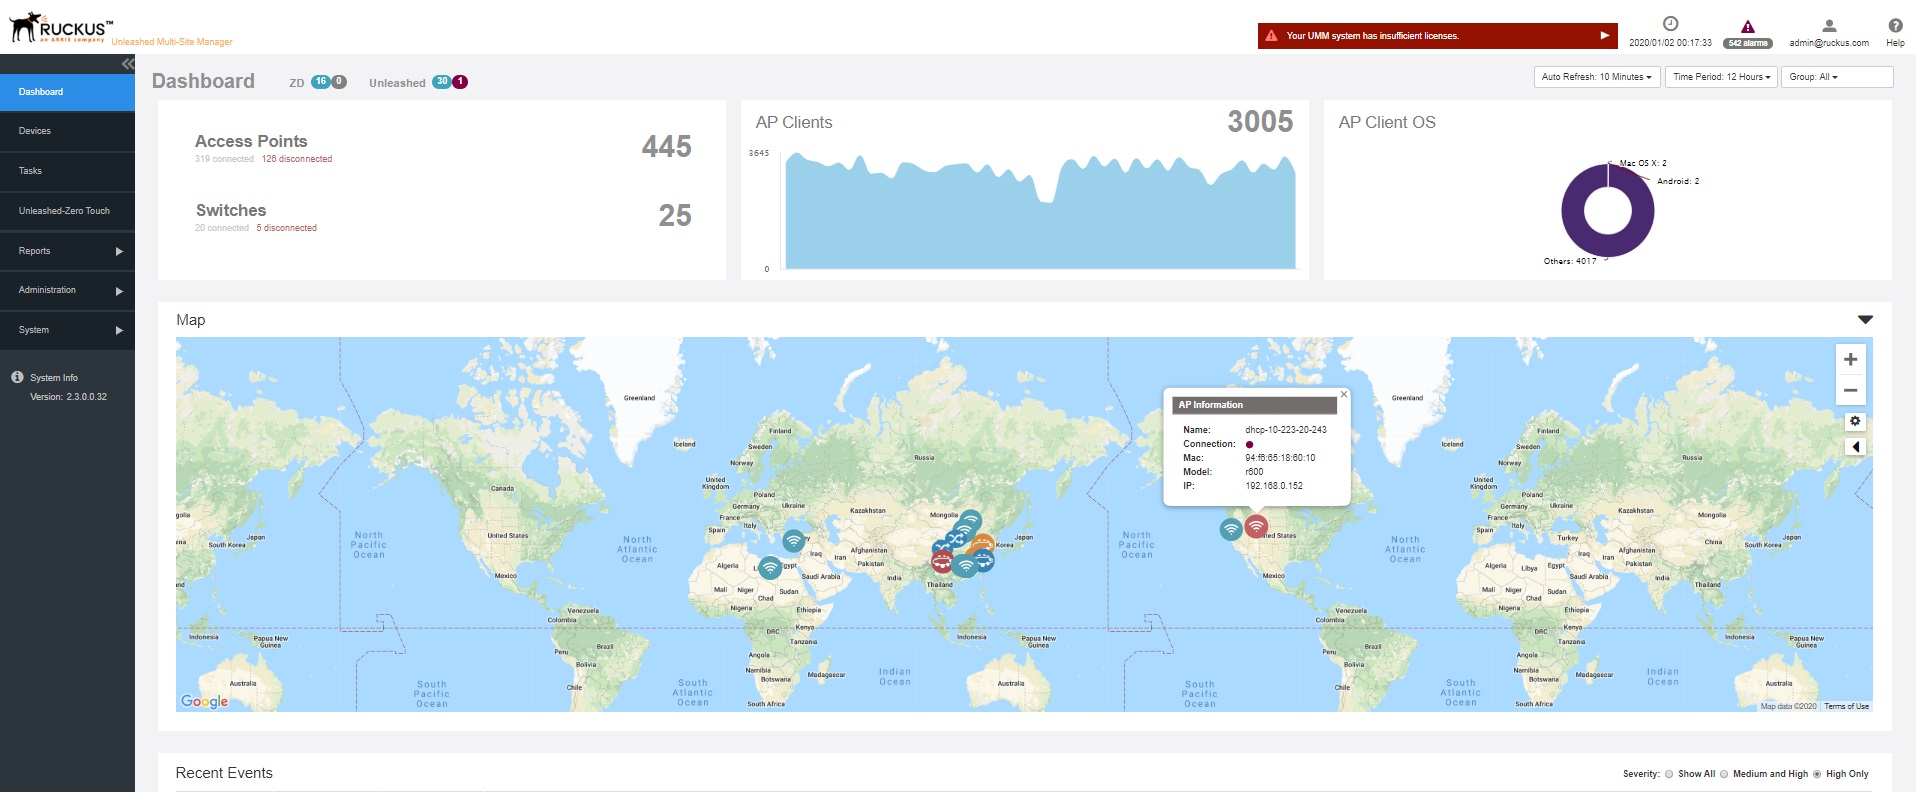
The Dashboard displays at-a-glance information about the following managed devices:
- The number of connected and disconnected ZoneDirector and Unleashed devices.
- The number of connected and disconnected switches.
- The number of APs that are registered with ZoneDirector and Unleashed devices (which,
in turn, are being managed by
Unleashed Multi-Site Manager).
UMM 2.2 update
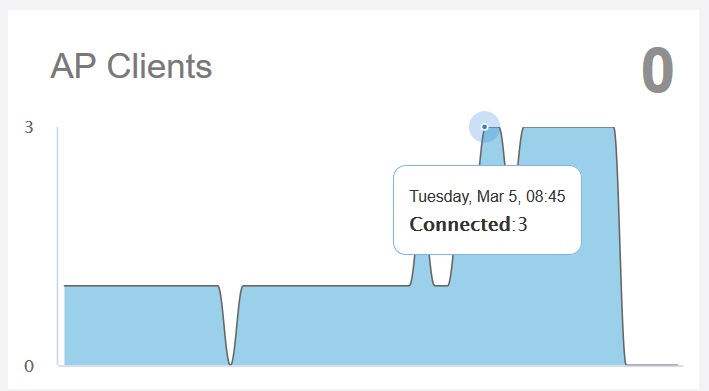
The number of AP clients that are associated with the currently connected APs are displayed. Pause the pointer along the graph to display the connected clients at any time within the selected time range. The graph displays the number of connected AP clients depending on the time period option selected. For example, if you select 12 hours, then the graph displays trends for devices connected for the last 12 hours.
-
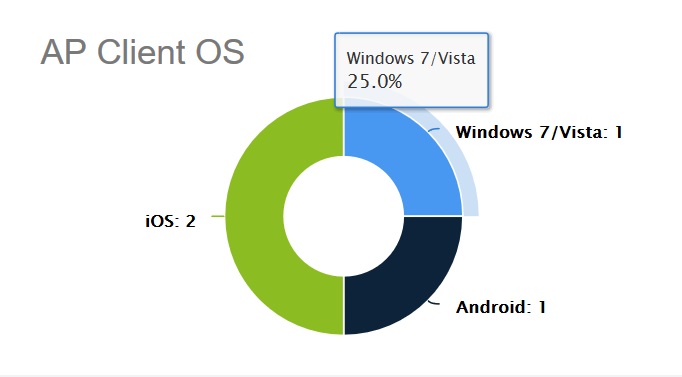
The AP Client OS panel displays a donut chart of wireless clients based on the operating systems (Windows, Vista, Android, iOS, and others) that they are running.
Pause the pointer on the chart to see the percentage share of OS used by client devices. For example, 56% for Windows means, out of the total client devices accessing the server, 56 percent of those devices are using the Windows operating system. The percentage of various versions of each OS accessing the server is displayed also.
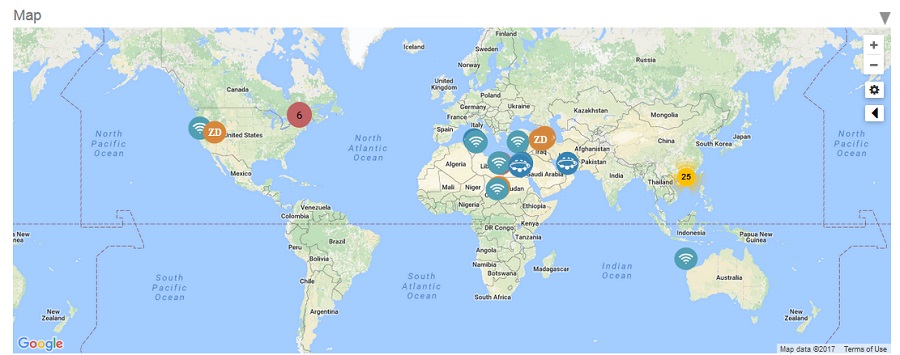
- A map which displays the AP and device information across the globe. Pause the pointer on the AP, switch, or device to see the respective statistics.
-
The Recent Events panel displays information about events that have occurred on Unleashed Multi-Site Manager, on managed ZoneDirector, Unleashed devices, ICX switches and on clients.
The following table describes the information that you can find on the Recent Events panel.
Columns on the Recent Events Panel
The information in the Recent Events can be displayed based on the severity (Show All, Medium and High , and High Only), which you can select from the top-right corner of the panel.