Monitoring Connected ICX Switches
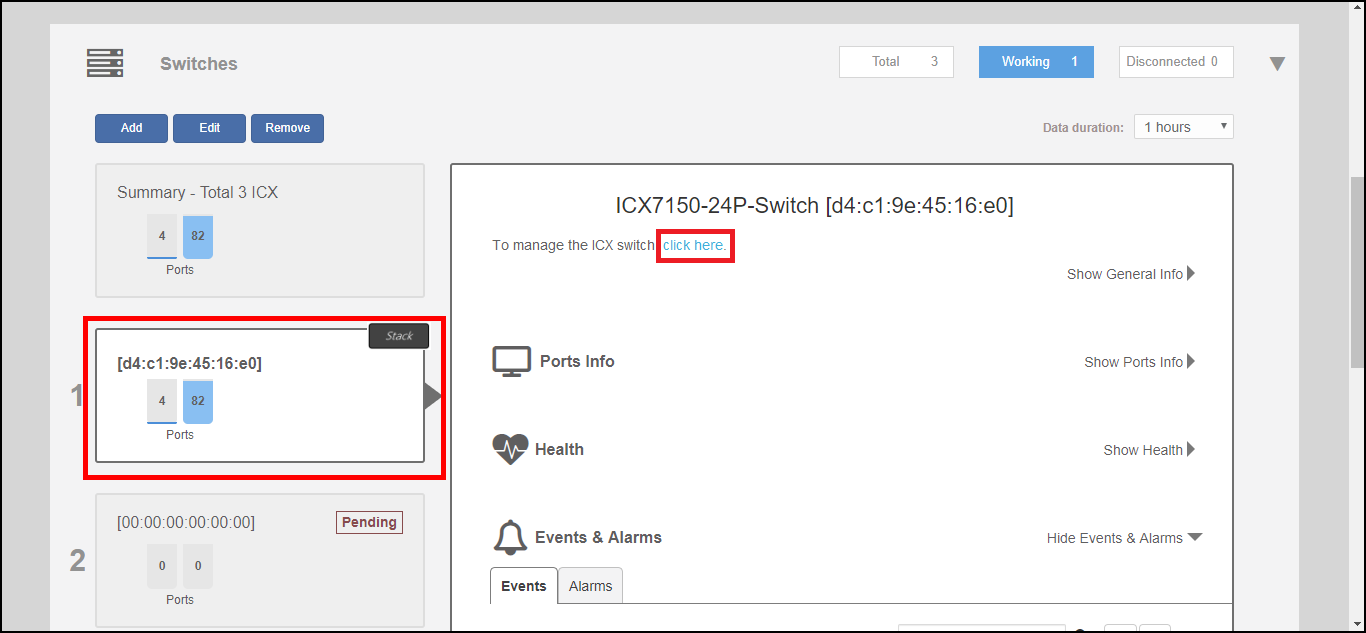
Expand the Switches
dashboard component and select a connected switch to view general information, port
status,
health details, and events and alarms on the selected switch.
The following details are displayed when the links are expanded:
- General Info: Displays general device information such as device name, IP address, MAC address, software version, and uptime.
- Ports Info: Displays the number of ports used and available, PoE power budget usage, and details on specific ports when selected from the port diagram or port list.
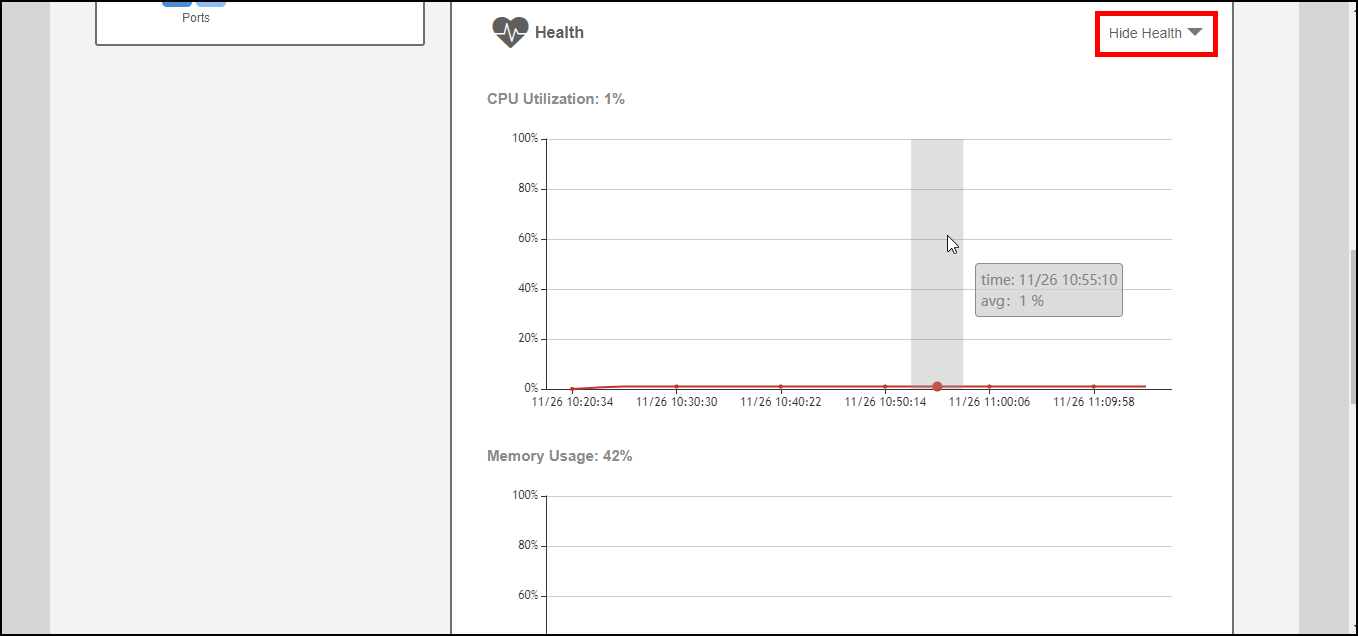
- Health: Displays hardware status information such as CPU and memory utilization.
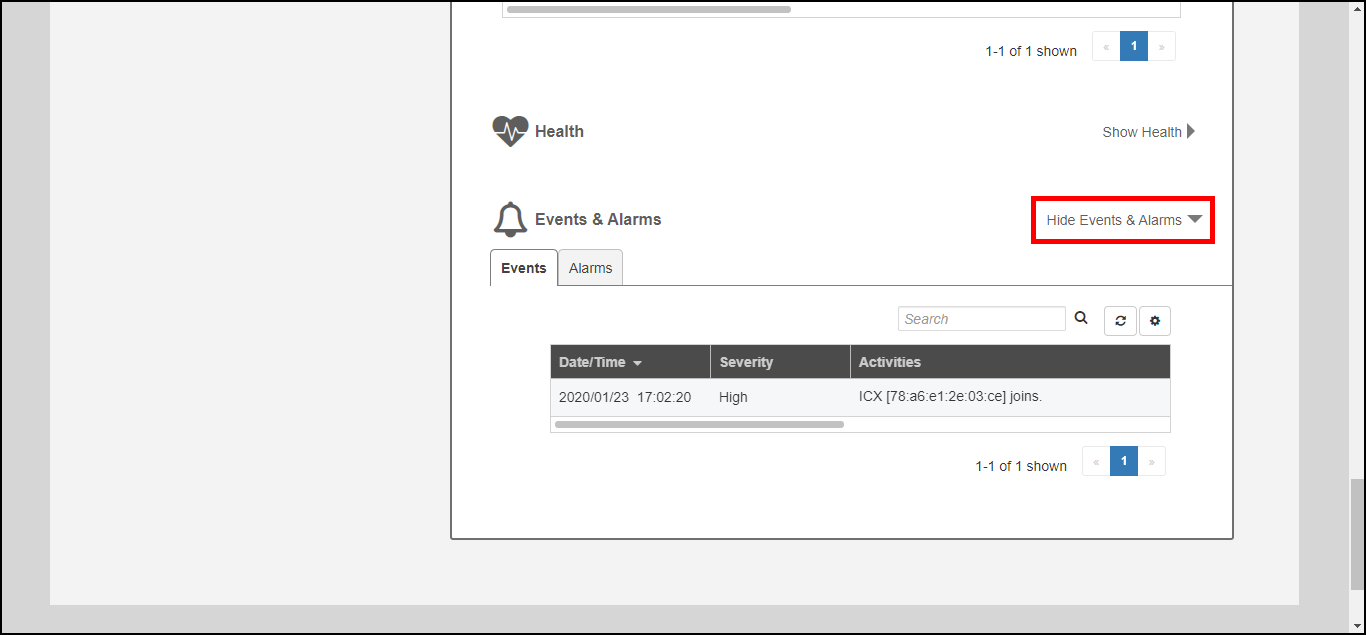
- Events & Alarms: Displays a list of alarm and event system messages.
Click Show Health to view the switch's health status information, including CPU and memory utilization, power supply usage, and temperature details. Hover over a segment of the charts to view time-specific details.
Click Show Events & Alarms to expand the section and view switch event and alarm lists.