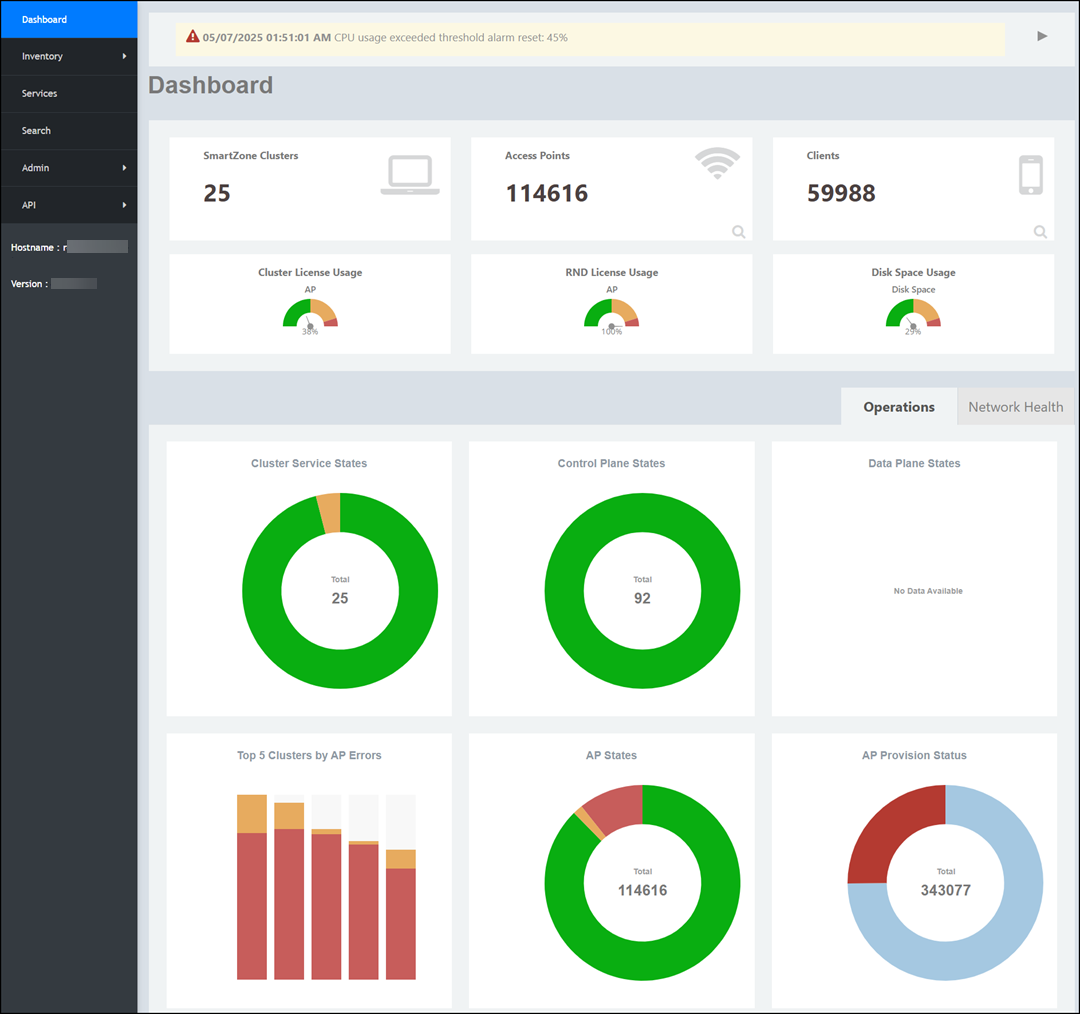
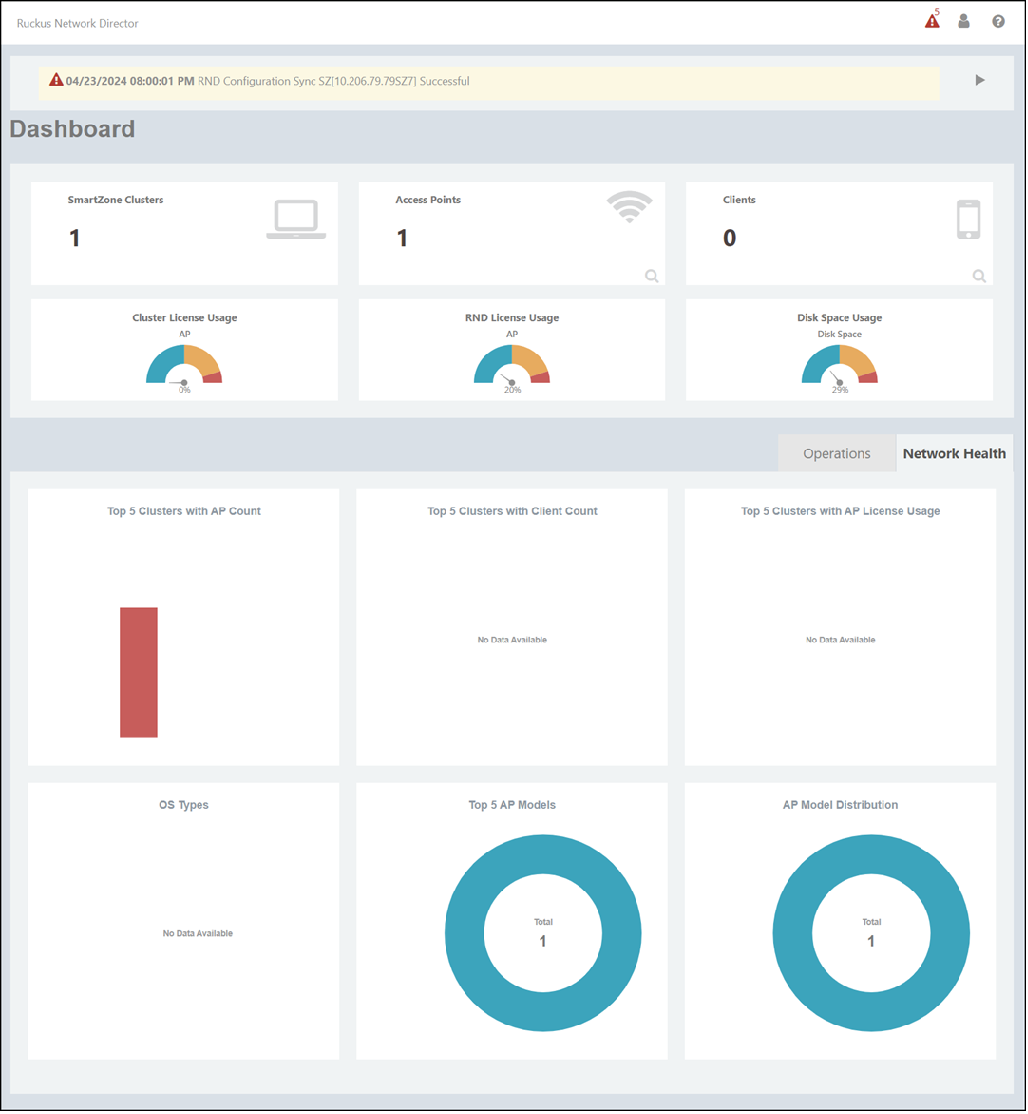
The Dashboard, which is the first page that is displayed after you log in to
the RUCKUS Network Director Admin portal, provides a snapshot of your wireless networks, SZs
connected to the network and those configured in the RUCKUS Network Director, access
points (APs), and the wireless clients associated with the APs. The Dashboard provides a centralized monitoring window for all APs and SZ
clusters and displays their operational status and statistics.
RUCKUS Network Director Dashboard (Operations)
RUCKUS Network Director Dashboard (Network Health)
The following table lists the infographic elements
of the Dashboard that describe the operations and
statistics of the entire network.
Note: The color-coded legends represent the operational status and statistics of clusters
and APs in the network. You can double-click the legend to isolate each trace.
Dashboard Elements
Network Element
Description
SmartZone Clusters
Total number of SmartZone clusters in the network.
Access Points
Total number of APs in all the clusters (the entire network).
Clients
Total number of clients in the network.
Cluster License Usage AP
Displays the percentage of all AP cluster licenses usage level.
RND License Usage
Displays the percentage of RND AP licenses usage level.
Disk Space Usage
Displays the percentage of disk space used.
Operations
Information about the operational state of the clusters and APs and indicates errors
in the network and alerts the user to take appropriate action.
Cluster Service States
Total number of clusters; also displays the breakdown of the cluster count based on
the operational status.
Control Plane States
Total number of control planes; also displays the breakdown of the control plane count
based on the operational status.
Data Plane States
Total number of data planes; also displays the breakdown of the data plane count based
on the operational status.
Top 5 Clusters by AP Errors
Top five clusters that have the most number of APs that are offline or flagged.
AP States
Total number of APs in the cluster; also displays the breakdown of the AP count based
on the operational status.
AP Provision Status
Total number of APs in the cluster; and also displays the breakdown of the methods
by which the APs are added to
RUCKUS Network Director: Imported, Default Provisioned, Provisioned, or UnProvisioned.
Network Health
Provides the AP statistics based on which the user can modify the network configurations.
Top 5 Clusters with AP Count
Top five clusters that have the most number of APs.
Top 5 Clusters with Client Count
Top five clusters that have the most number of associated clients.
Top 5 Clusters with AP License Usage
Top five clusters that have the most AP license usage.
OS Types
Total number of the operating systems used by the associated clients with a percentage
breakdown.
Top 5 AP Models
Top five AP models that have the most number of clients.