Getting to Know the Dashboard
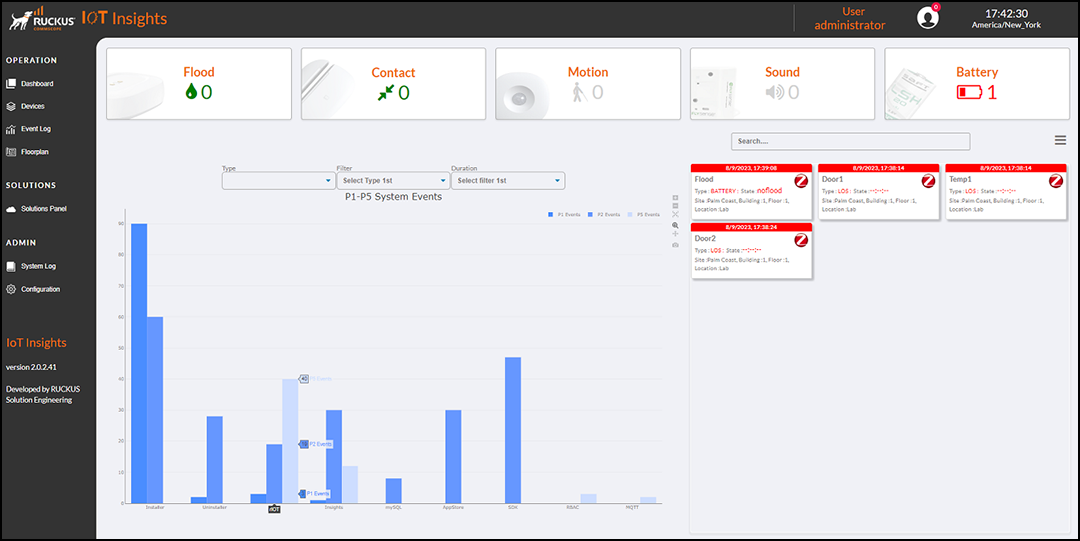=GUID-CF30EF1E-766F-4AAA-A23E-B557CE0B8319=1=en-US=Low.png "Getting to know Dashboard")
Banner
The Banner is the horizontal bar atop the Dashboard that contains the user ID, user icon, and local time.

The user ID displays the name of the current user. When you pause the pointer over the user icon, the Your Session dialog box is displayed.
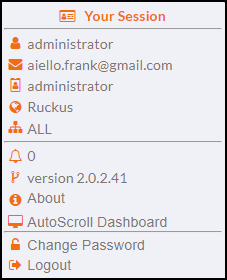
The Your Session dialog box is divided into three sections.
- The top section contains the user ID, the user email address, the role of the user (operator, supervisor, or administrator), the realm of the system under management, and the sites the user is authorized to manage and monitor.
- The middle section provides information about the number of alarms or notices, the version number, and theAbout link. When you click About, an information window displays details of the current version and a link to the Release Notes.
- In the bottom section, you can change your password and log out of the system. Change the password by clicking Change Password. A dialog box displays the message "Change your Insights Password". Change the password and click Update.
Navigation Menu
The Navigation Menu provide links and access to functions based on the user role and user ID. The visibility of certain links depends on the access rights and access level of logged-in users. For example, operators do not have access to the configuration panel. Certain menus in the configuration panel are restricted and can be accessed only by an administrator, such as Marketplace.
The Navigation Menu consists of following functionalities:
- Dashboard: Displays the Dashboard components
- Devices: Loads the device lists and status table
- Event Log: Loads the IoT Event Log table
- Floorplan: Loads the Floorplan Viewer and the Floor Selector Page
- Solutions Panel: Loads the Installed IoT Solutions menu
- System Log: Loads the System Event Log used to view the system-level status and notifications
- Configuration: Loads the functionalities managed by the administrator or supervisor
Dashboard Components
The Dashboard is divided into three main components.
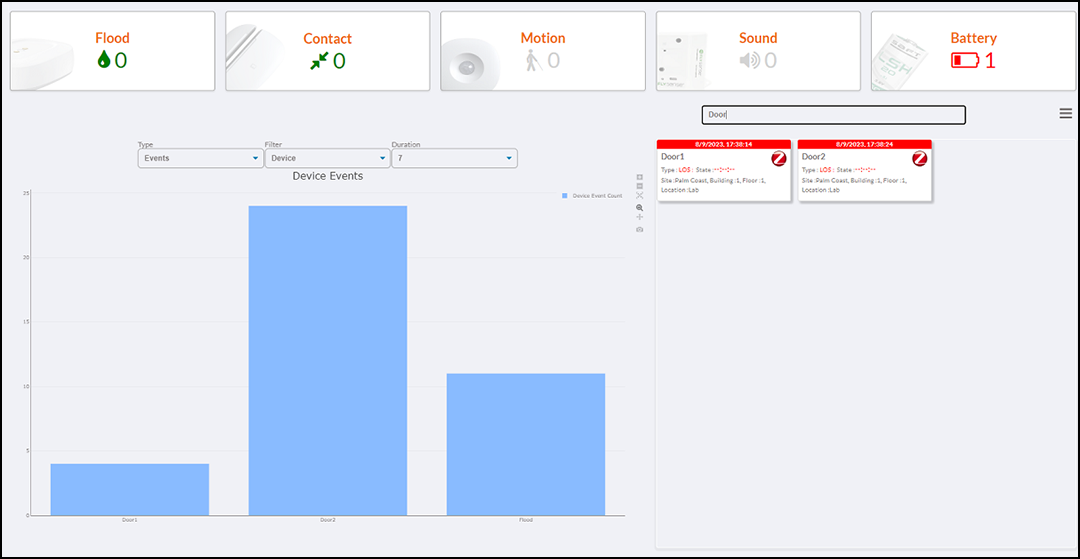
- Event
Types Overview:- The Event Types Overview provides
an overview of the current state of five event types
within the system and the number of devices that are
in this state.
Event Types
-
User-Configurable Event or Graph: The
User-Configurable Event or Graph provides a
graphical representation of the type, location, and
devices of the session.The graph is modified by
selecting the possible options from the Type, Filter, and Duration lists.
- The Type list consists of following options.
- Based on the option selected in the Type selected, the Filter list changes. If the type is Events, the Filter list contains the following
options:
- Type (sorts all events based on the type of event)
- Location (sorts all events based on the location of the event)
- Device (sorts all events based on the device name)
If the type is System, the Filter list contains the following options:
- P1 (Blocker-level event count)
- P2 (Critical-level event count)
- P3 (High-level event count)
- P4 (Medium-level event count)
- P5 (Trivial-level event count)
- P* (All Events P1-P5 Separated and Sorted counts)
If the type is Alarms, the Filter list contains the following options:
- Battery (Total number of Battery alarms per hour sorted by device name)
- LOS (Total number of Loss of Signal alarms per hour sorted by device name)
- RSSI (Total number of Network RR Signal alarms sorted by device name)
- LQI (Total number of Network Quality alarms sorted by device name)
- Alarm (Total number of Network Quality alarms sorted by device name)
- The Duration list contains the number of days for which the data is recalled for sorting and illustration.
- Even Table: The Event Table provides a live view of the current status of all devices in the system. For each device, the table lists the location within the building or site, and the condition that triggered the event. Additionally, it provides the time stamp of the occurrence of the event (with events of interest identified in red). Specific high-level incidents, such as battery, LOS, RSSI, LQI, and alarm events are flagged for user or operator information and interaction.
Search Field
The operator can filter the contents of the Event field using the Search field. By entering a value in the Search field any entry in the table containing the value is shown and the remaining table entries are not shown.
Additionally, the Search field can be used to filter table contents based on color. For example, entering "red" in the Search field results in a list of all entries marked in red.
The Search field function also allows the user to find specific types of events quickly and easily if there are lots of entries in the table.