Monitoring the Cluster
Once your cluster has been created, you can go to the Administration > Replication area of the Cloudpath UI.
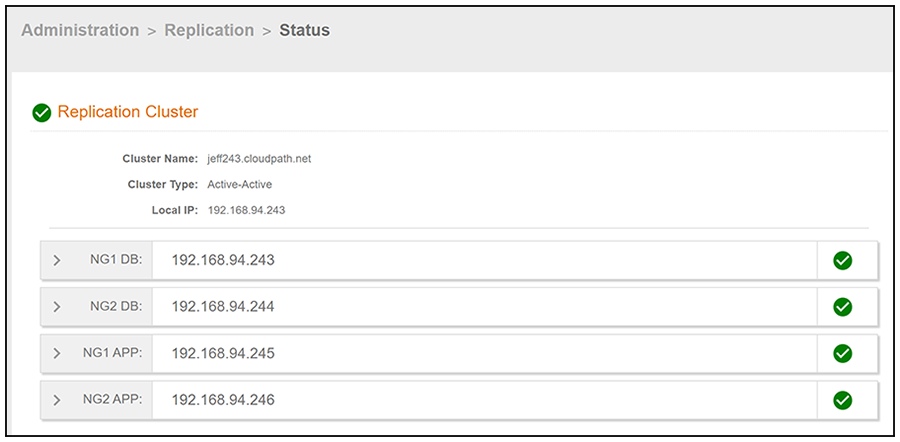
If the cluster was successfully created, green check marks will appear to the right of the IP address of each node, as shown in the example below. If green check marks do not appear, expand the node information by clicking on the arrows, and click one of the log buttons (as shown in Detailed Information for a Node in the Cluster).
You can expand the information for the nodes by clicking on the arrow. The following figure shows an example of Node Group 2 APP expanded:
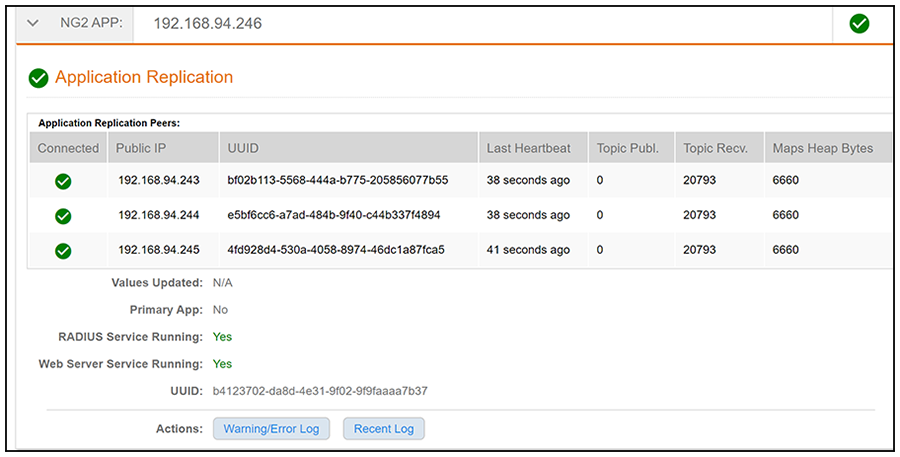
You can click the two log buttons at the bottom of the screen for additional information.
For additional information about a cluster node, refer to the following in https:
<cloudpathhostname>/admin/systemHealth/viewHistoricMetricLogs where <cloudpathhostname> is the fully qualified domain name of a node in the cluster.: