Running Replication Diagnostic Tests
Showing the Replication Configuration
You can run the replication show-config command from either cluster node to view status about each node.
The following command (and corresponding output) is an example from the active (primary) node that was shown in Configuring an Active - Standby Replication:
# replication show-config
----------------------------------------------------------------------------------
     Primary - 192.168.94.243   ssh port# 8022
     Secondary - 192.168.94.244   ssh port# 8022

     Type - ACTIVE-STANDBY

     Virtual IP - 192.168.94.245

     Cluster Name - jeff243.cloudpath.net

    INET:
     inet 192.168.94.243/22 brd 192.168.95.255 scope global ens32
     inet 192.168.94.245/32 scope global ens32
Showing the Replication Status
You can run the replication show-status command from either cluster node. The following command (and corresponding output) is an example from the cluster that was shown in Configuring an Active - Standby Replication:
# replication show-status
[sudo] password for cpn_service:
******************** MASTER(192.168.94.243) >>>>>>  REPLICA (192.168.94.244) ********************

Master (192.168.94.243) Status
----------------------------------------------------------------------------------------------
            File: mysql-bin.000009
        Position: 39455
----------------------------------------------------------------------------------------------

Replica (192.168.94.244) Status
----------------------------------------------------------------------------------------------
                Replica_IO_State: Waiting for master to send event
                   Master_Host: 192.168.94.243
               Master_Log_File: mysql-bin.000009
           Read_Master_Log_Pos: 39455
                Relay_Log_File: mysql-relay-log.000003
                 Relay_Log_Pos: 37516
         Relay_Master_Log_File: mysql-bin.000009
              Replica_IO_Running: Yes
             Replica_SQL_Running: Yes
                    Last_Errno: 0
                    Last_Error:
           Exec_Master_Log_Pos: 39455
         Seconds_Behind_Master: 0
                 Last_IO_Errno: 0
                 Last_IO_Error:
                Last_SQL_Errno: 0
                Last_SQL_Error:
                     SQL_Delay: 0
           SQL_Remaining_Delay: NULL
       Replica_SQL_Running_State: Replica has read all relay log; waiting for the replica I/O thread to update it
----------------------------------------------------------------------------------------------


******************** MASTER(192.168.94.244) >>>>>>  REPLICA (192.168.94.243) ********************

Master (192.168.94.244) Status
----------------------------------------------------------------------------------------------
            File: mysql-bin.000010
        Position: 23246974
----------------------------------------------------------------------------------------------

Replica (192.168.94.243) Status
----------------------------------------------------------------------------------------------
                Replica_IO_State: Waiting for master to send event
                   Master_Host: 192.168.94.244
               Master_Log_File: mysql-bin.000010
           Read_Master_Log_Pos: 23246974
                Relay_Log_File: mysql-relay-log.000003
                 Relay_Log_Pos: 3111
         Relay_Master_Log_File: mysql-bin.000010
              Replica_IO_Running: Yes
             Replica_SQL_Running: Yes
                    Last_Errno: 0
                    Last_Error:
           Exec_Master_Log_Pos: 23246974
         Seconds_Behind_Master: 0
                 Last_IO_Errno: 0
                 Last_IO_Error:
                Last_SQL_Errno: 0
                Last_SQL_Error:
                     SQL_Delay: 0
           SQL_Remaining_Delay: NULL
       Replica_SQL_Running_State: Replica has read all relay log; waiting for the replica I/O thread to update it
**********************************************************************************************
Some important items to check in the preceding output include making sure the following are true:
- Replication is occurring:
Replica_IO_Running: Yes Replica_SQL_Running: Yes - No errors:
Last_Errno: 0
Last_Error:
Last_IO_Errno: 0
Last_IO_Error
- Master and replica are in sync: The value of Master position is the same as (or very close to) the values of Read_Master_Log_Pos and Exec_Master_Log_Pos for both Master/Replica outputs above.
Pinging the Load Balancer (for Active - Active Setups Only)
You can check the availability of each node in the cluster from the load balancer by running the following command: https://<cloudpathhostname>/admin/pingnode
where cloudpathhostname is the fully qualified domain name of a node in the cluster.
The HTTP return should be a "Success" message, and the HTTP status code should be 200.
Checking Cluster Service Configuration
After replication setup, the HTTPS server names on both cluster nodes must match the Cluster DNS name that you chose while running the replication setup command.. You can run the show config command from each cluster node to view the cluster service configuration. For example, based on the active-standby setup described in Configuring an Active - Standby Replication, if the show config command is run on the secondary node, the output would appear as:
# show config
VM CPU: Intel(R) Xeon(R) CPU E5-2697 v3 @ 2.60GHz
VM Cores: 2 (CPUs * Cores Per CPU)
VM Memory: 6 GB
FIPS: Disabled
Network Config: Static
Hostname: jeff244.cloudpath.net
IP: 192.168.94.244
Netmask: 255.255.252.0
Gateway: 192.168.92.1
DNS: 192.168.222.254
Proxy: Disabled.
NTP: pool.ntp.org
Timezone: America/Denver [MDT]
HTTPS: Enabled on port 443 (80).
HTTPS Server Name: jeff243.cloudpath.net
Admin Web UI: Not restricted.
Hostname Restriction: Not restricted.
SSH Access: Permitted on port 8022.
#
The IP of the secondary node is displayed correctly as 192.168.94.244, and the HTTPS server name is displayed correctly as jeff243.cloudpath.net, which is the cluster name specified while running the replication setup command.
Firewall Settings
The Cloudpath Admin UI provides a table that lists the inbound and outbound traffic of your Cloudpath system. This information is dynamically generated based on the current system configuration and can changes as the system configuration is modified.
Go to to ensure that your firewall ports have been correctly configured for replication.
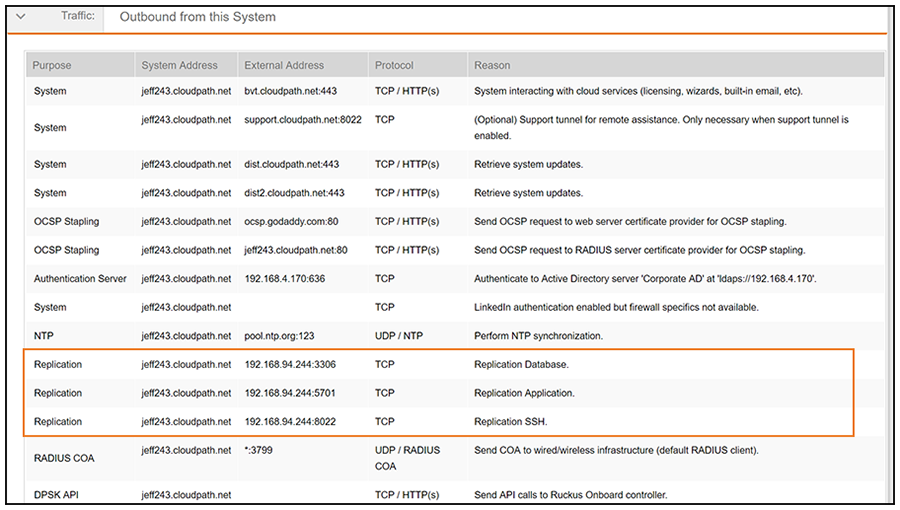
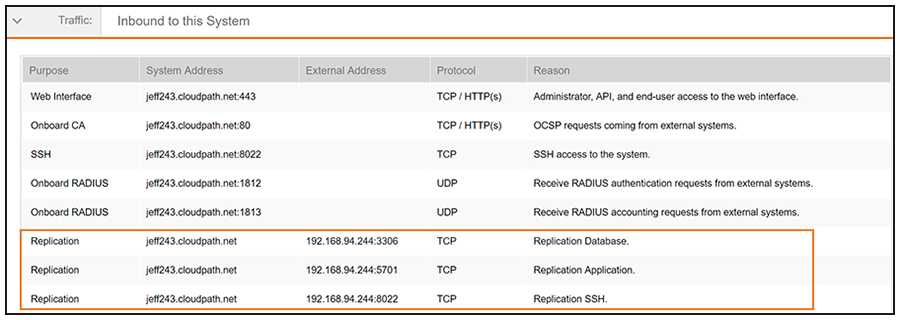
Replication ports are provided when replication is configured and running.
Checking Workflow Snapshots
Log on to the Cloudpath system administration portal for each cluster node, go to Configuration > Workflows, and ensure that there are no error messages for any accounts indicating the following: "Enrollment Portal URL and HTTPS server are mismatched."