Getting to Know the Dashboard

The Dashboard is the first page displayed after you log in to the remote management services Domain portal. It provides a snapshot of your Unleashed networks and managed devices.

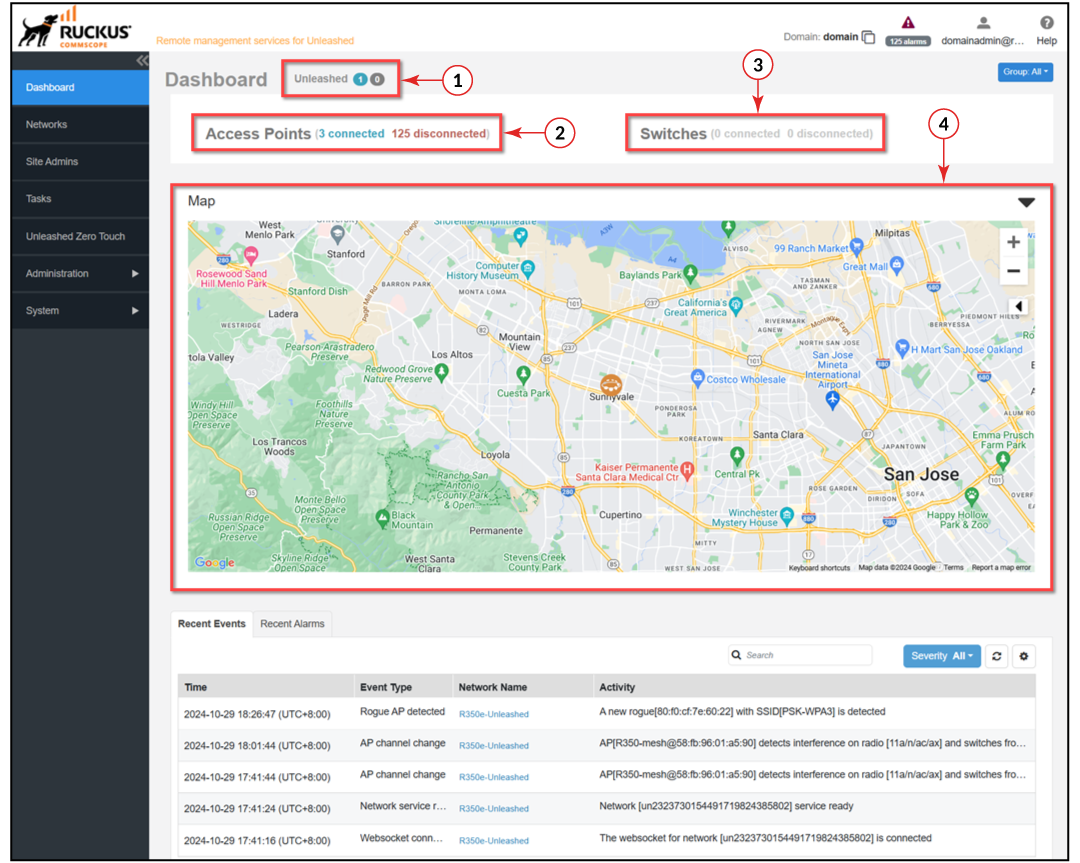
Domain Admin Portal - Dashboard

Dashboard Elements

Number Network Element Description
Dashboard The content area of the RUCKUS Remote management services for Unleashed Dashboard displays the following information:
1 Unleashed Displays the number of connected and disconnected Unleashed devices (when the Group filter is set to All).
2 Access Points Displays the number of APs.
3 Switches Displays the number of connected and disconnected Unleashed-managed switches.
4 Map A map which displays the network information across the globe.
5 Recent Events

The Recent Events tab displays information about events that have occurred on remote management services for Unleashed networks. The following table describes the information available on the Recent Events tab.

  • Time: Displays the date and time that the event occurred.
  • Event Type: Displays the name of the event (as assigned by RUCKUS).
  • Network Name: Name of network reporting the event. Click the network link to go to the devices reporting the specific event.
  • Activity: Description of the event activity.

The information displayed in the Recent Events tab can be customized:
  • Use the Severity drop-down menu in the top-right corner of the panel to display events based on the severity (All, Medium and High, and High Only).
  • Use the icon to refresh the events page.
  • Use the icon in the top-right corner of the panel to change the number of rows displayed per page and change which table columns are displayed.
6 Recent Alarms Displays the number of alarms that have been generated on your networks and you can find the detailed information on the Alarms tab.
  • Time: Displays the alarm time stamp.
  • Severity: Displays the severity of the alarm such as Warning, Minor, Major, and Critical.
  • Network Name: Name of the device reporting the alarm. Click this link to go to the devices reporting the specific alarm.
  • Alarm Type: Displays the type of alarm such as AP traffic, number of channel changes, and so on.
  • Activity: Description of the issue that triggered the alarm.