Application Overview
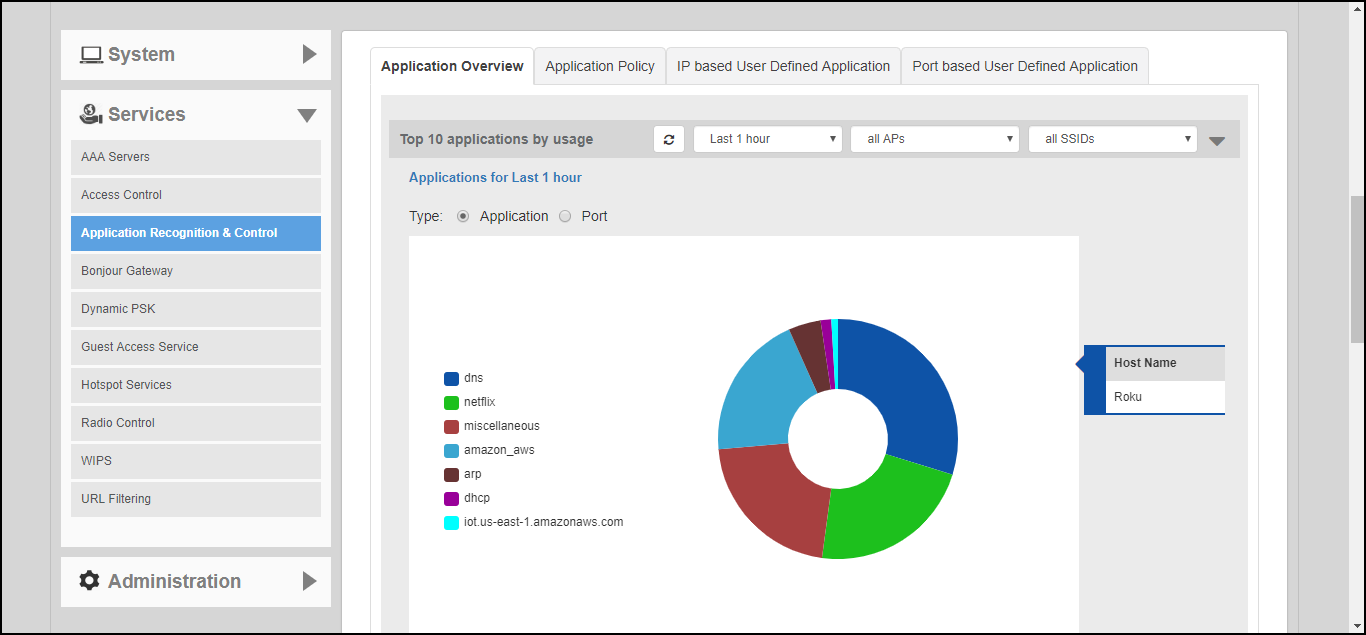
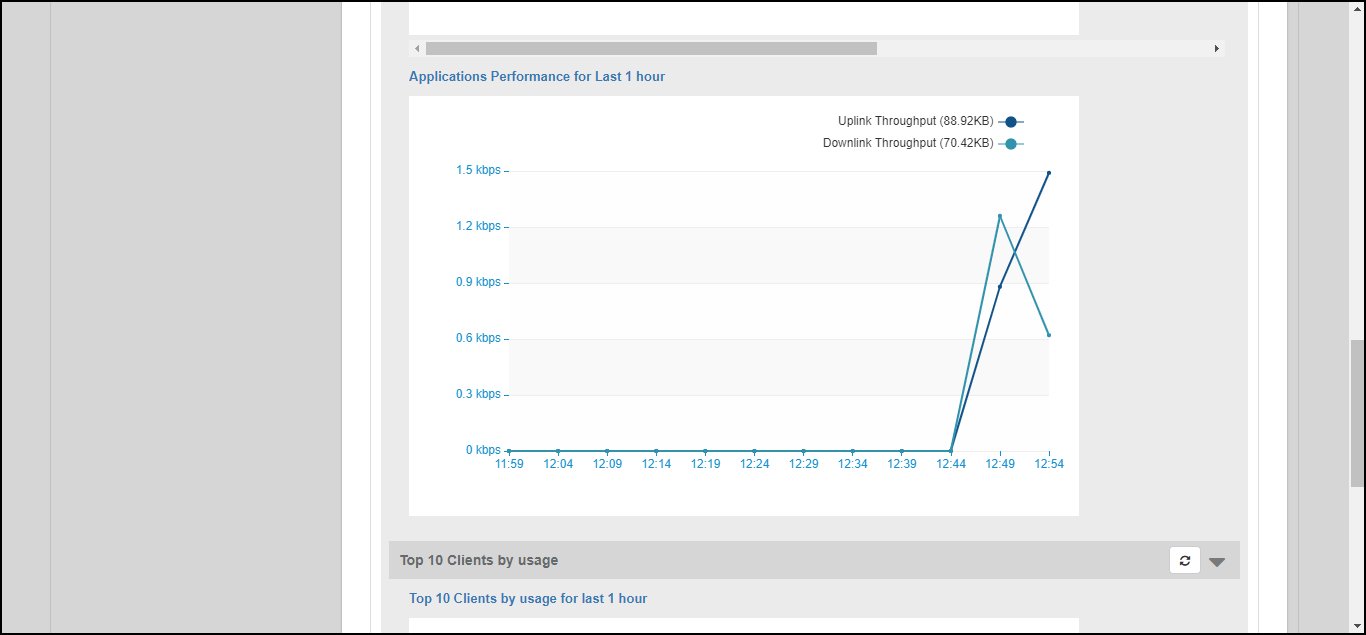
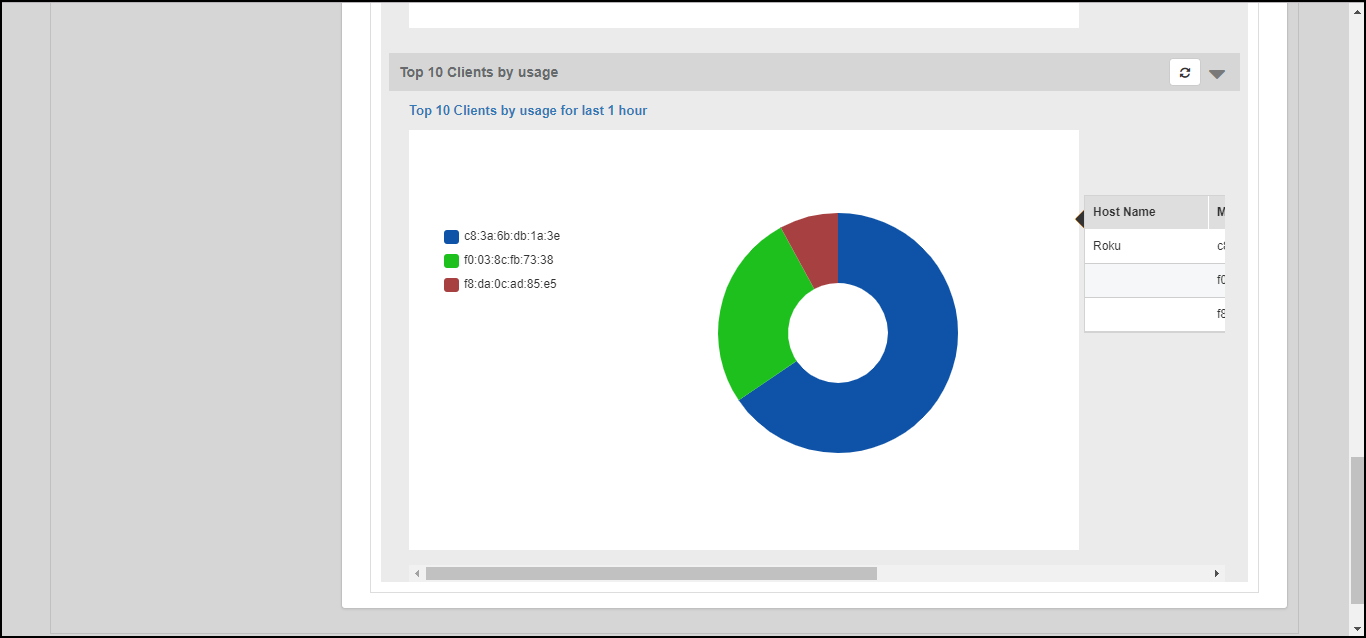
The Application Overview page displays the top 10 applications and the top 10 clients
by usage for the last 1 hour or 24 hour time period.
Use the drop-down menus at the top of the graphs to filter results by time period, AP group or SSID.
You can also choose to display applications by their application name or by port number. Hover over a section of the pie chart to display a breakdown of total, uplink and downlink values.
The Top 10 clients chart also shows the client's MAC address and percentage of total traffic for this client when you hover over the pie chart.